- Home
- Exchange
- Exchange Team Blog
- Establishing Exchange Content Index Rebuild Baselines – Part 3
- Subscribe to RSS Feed
- Mark as New
- Mark as Read
- Bookmark
- Subscribe
- Printer Friendly Page
- Report Inappropriate Content
In Part 1 of this series, I explained the E2K7_IndexRebuildAnalyzer.ps1 script and in Part 2, I discussed the Search Rebuild Framework that Anatoly Girko and I developed. Before concluding this series I did want to provide a series of graphs as well as an “observed averages” table that illustrate the rebuild characteristics we have observed since the inception of the framework. Hopefully this allows for better conceptualization as well as empowering you to make better estimates when calculating your own rebuild rates..
Observed Averages to Date within Microsoft
Anatoly and I went back and forth on how to best to present this. As one might imagine there are an infinite number of possibilities for presentation. We decided to scope the graphs and table to the message size that most Exchange Storage Architects design to: 150 KB per mail item. We then performed a secondary filter on Mailbox Count and only took into account Mailbox Databases within our data collections that had 100 or more active mailboxes to build the averages below. Once done, we removed the 10% best performing and 10% worst performing rebuild operations from within our collection to derive the averages used to build the graphs and tables.
Note: In the various graphs and table to follow Averages Mailbox Sizes in several range increments are noticeably missing. This data was not overlooked or purposefully omitted. Absence of statistical data for these ranges is due to the fact that no valid data exists in our historical collections. Put another way we have never performed Content Index rebuild operations and/or collected Post-Rebuild metrics for databases where the Average Mailbox Sizes for end user mailboxes were in the following ranges:
- 1700-1799 MB
- 1800-1899 MB
- 2000-2099 MB
- 2100-2199 MB
Graphs
We will be presenting four Excel Pivot Charts that reflect the throughput characteristics we have observed to date based upon the filtered collection as described above. These Pivot Charts are meant to illustrate the relationship that exists between various properties as they occur within and around the Mailbox Store (e.g. mailbox count, item count and EDB file sizes) and contrast them with the historical throughput times required to complete Full Crawl against Mailbox Stores with similar characteristics.
Graph 1
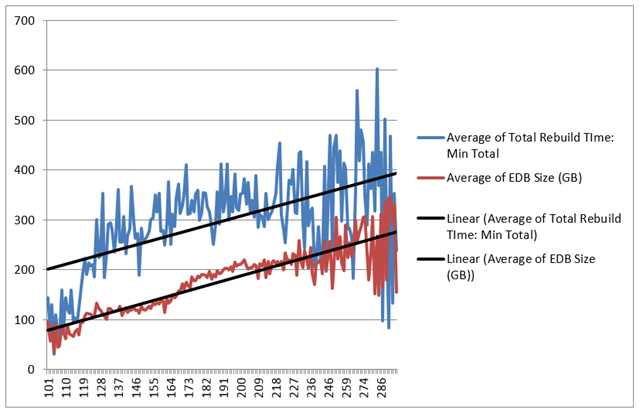
The view contained within Graph-1 specifically depicts the relationship between Mailbox Counts per Database, the relative size of the Mailbox Databases in gigabytes and how this ultimately impacts the total time to complete Content Index rebuild of the Mailbox Stores in minutes.
This graph makes a clear argument that as the total number of active mailboxes on an Exchange Mailbox Database increases there will also tend to be a parallel relationship for increases to the EDB file size on the storage subsystem. This relationship subsequently has an impact on the overall time to complete a Full Crawl of a Content Index. This is really just a fancy way of saying that: with more active mailboxes typically comes more mail items; with more mail items comes a larger EDB file size on disk; the larger an EDB file size is on disk the longer it will “usually” take to rebuild a Content Index. The only situation where this hypothesis will never hold true is in the case of a Mailbox Database that had a large amount of whitespace present in the file. In such a case the overall time to complete a Content Index rebuild will be noticeably faster than anticipated. This anomaly situation has been seen within the environments we support but the subsequent statistics were removed from our collection by leveraging the filtering technique discussed above.
Graph 2
Graph-2 depicts the relationship that exists between the Average Mailbox Size (for mailboxes that exist on databases contained within the same filtered sample set) and how it impacts the Content Index rebuild throughput at the Mailbox Database level in Seconds per/mailbox.
This graph essentially restates the argument presented in Graph-1 albeit at the active mailbox level. Specifically as the active mailbox size averages increase so do the average number of mail items within those mailboxes. On average the more mail items within a mailbox the longer it will take the Search Indexer to complete crawl against a given mailbox which in turns impacts how long it will take to complete Full Crawl for all mailboxes within the database.
Graph 3
Graph-3 depicts the relationship that exists between the Average Mailbox Size (for mailboxes that exist on databases contained within the same filtered sample set) and how it impacts the Content Index rebuild throughput in Megabytes per/second.
Graph-3 builds on the initial hypothesis alluded to in Graph-2. Specifically it shows that as the Average Mailbox Size and Average Item Counts within a Mailbox Database increase there is a negative relationship with respect to Search Indexer throughput. Graph-3 shows this relationship in megabytes per second.
Graph 4
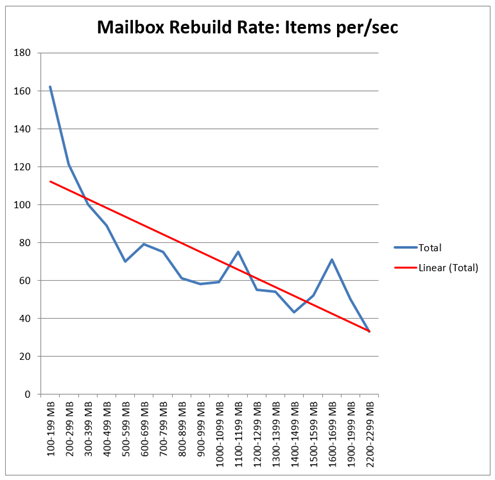
Graph-4 depicts the relationship that exists between the Average Mailbox Size (for mailboxes that exist on databases contained within the same filtered sample set) and how it impacts the Content Index rebuild throughput in Items per Second (based upon Average Message Size of 150KB):
As was the case with Graph-3, Graph-4 shows the negative performance impact with respect to throughput in Items per/second.
Observed Averages Table
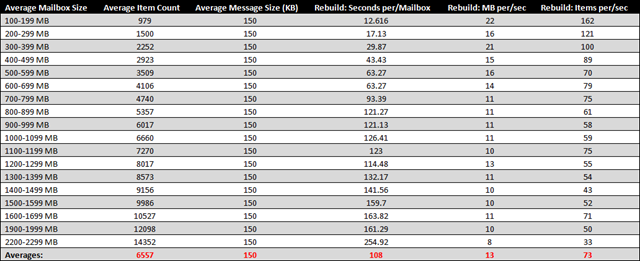
To present the table we utilized the same filtered set (described above and presented in the graphs) but elected to create focused averages based upon Average Mailbox Size. These rows are subsequently delineated as independent rows in increments of 99 megabytes. The throughput characteristic for each row represents the aggregate averages for all similarly sized databases that have completed rebuild operations in our collection. Specifically where the Average Message Size was 150KB and the Average Mailbox Size for all active mailboxes on those databases were within the ranges defined by Column-A.
The historical averages presented in this table (at least to me) produce three potential ways of estimating Content Index rebuild times:
- A “Historical Average” could be implemented based upon Average Mailbox Size where the Average Message Size for items residing within those mailboxes is 150KB. Because we have large amounts of historical rebuild data in our collection we choose to leverage this average. We derive our estimate by determining the Average Mailbox Size value via “pre-rebuild” metrics and compare this to the historical average. We then take the composite average for Rebuild: Seconds per/Mailbox and then multiply that figure by the number of mailboxes on the database which require crawling to determine the total time necessary to complete.
- An “Organizational Average” could also be established based upon Average Message Size irrespective of the number of items and average size of the mailboxes across the organization (that Organizational Average is provided in the Averages Row above).
- A composite average between historical average and organizational average.
For example, if I have a Content Index that needs to be rebuilt for a database whose users have an aggregate Average Mailbox Size in the 500-599 MB range and assuming the Average Message Size is 150KB, if that database has 200 users on it, I could derive the estimate in one of three potential ways:
The Historical Averages Table:
200 mailboxes * 63 seconds = 12,600 seconds total. This equates to 210 minutes or roughly 3.5 hours to complete Full Crawl.
The “Organizational Average”:
200 mailboxes * 108 seconds = 21,600 seconds total. This equates to 360 minutes or roughly 6.0 Hours to complete Full Crawl.
Composite Average (Average of “Historic” + “Organizational”):
3.5 + 6.0 = 9.5 Hours
9.5 / 2 = 4.75 Hours
Conclusion
The total time it takes to rebuild a Content Index will always be variable because mail populations and items therein are always variable too. When rebuilding Content Indexes the most accurate and robust estimates will always come from leveraging historical averages. I also wanted to mention that when I/we make decisions to rebuild Content Index internally at MSFT we do our best to schedule them for “least user impact” time intervals. However, our implementations are global so it is more or less impossible to completely eliminate end-user impact. The best you can hope for is to minimize the impact on the surface area. Furthermore, within our data collections we don’t factor in Search Indexer Throttling Delays. Any and all Search Indexer Rebuild Throttle Delays are handled and understood within the moment and are representative within the individual tickets as they are presented to operations. By leveraging the filtering techniques used throughout this post you insulate your figures from those negative averages (same is true for “overly high throughput” rebuild operations) making your overall estimates considerably more accurate.
If you are the type of personality that that has a propensity for betting with averages I fully stand by our table. If a more exact science is required, I would suggest implementing a framework such as the one we describe within this post series.
We hope you find this post series useful, and better yet, have learned something new along the way!
Happy Trails!
Eric Norberg
Service Engineer
Office 365-Dedicated
You must be a registered user to add a comment. If you've already registered, sign in. Otherwise, register and sign in.


