- Home
- Exchange
- Exchange Team Blog
- Advanced Exchange 2007 Transport Logs Troubleshooting using Log Parser - Part 2
- Subscribe to RSS Feed
- Mark as New
- Mark as Read
- Bookmark
- Subscribe
- Printer Friendly Page
- Report Inappropriate Content
This is a second in my series of posts that deal with using Log Parser tool to analyze your Exchange 2007 transport logs. For the first post, please go here.
I have written this blog post in a way that I walk you through building more and more complex Log Parser queries, which I hope will help you with learning how to build your own queries.
Log Parser (also referred to as LP in this blog post) can take advantage of Office Web Components to draw charts of your mail flow information. To download the Office Web Components, please go here:
http://www.microsoft.com/downloads/details.aspx?FamilyID=7287252C-402E-4F72-97A5-E0FD290D4B76&displa...
When installed, you can use the integration of LP and Office Web Components.
For example, typing:
logparser -h -o:CHART
will give you a chart output. Here are different options for chart types you can use:
LineMarkers, LineStacked, LineStackedMarkers, LineStacked100, LineStacked100Markers, Line3D, LineOverlapped3D, LineStacked3D, LineStacked1003D, SmoothLine, SmoothLineStacked100, BarClustered, BarStacked, BarStacked100, Bar3D, BarClustered3D, BarStacked3D, BarStacked1003D, ColumnClustered, ColumnStacked, ColumnStacked100, Column3D, ColumnClustered3D, ColumnStacked3D, ColumnStacked1003D, Pie, PieExploded, PieStacked, Pie3D, PieExploded3D, ScatterMarkers, ScatterSmoothLine, ScatterSmoothLine, AreaStacked3D, StockHLC, PolarMarkers, PolarSmoothLineMarkers [default value=Line]
Identifying top senders to your system
Using the integration with Office Web Components in LP you can extract the top 10 senders to your system:
logparser "select top 10 REVERSEDNS(EXTRACT_PREFIX(remote-endpoint,0,':')) as RemoteSendingHost, count(*) as Hits into topsender.gif from RECV20070608-1.LOG group by RemoteSendingHost order by Hits DESC" -i:CSV -nSkipLines:4 -o:CHART -chartType:PieExploded3D -chartTitle:"Top 10 senders"
 So far so good, but I can hear you say: "This is great but this is going to take forever on my productions logs so how do I optimize this?" One option is to filter by using the event field when it is equal to '+'. The '+' in the event field identifies a new connection so it will just happen once per SMTP connection. That being said this can still take some time especially if a lot of spammers are trying to hit the servers.
The sample bellow extracts top inbound connection filtered where event equals to '+' (as the plus sign means a new inbound connection):
logparser "select top 10 REVERSEDNS(EXTRACT_PREFIX(remote-endpoint,0,':')) as RemoteSendingHost, count(*) as Hits into topsender.gif from RECV*.LOG where event='+' group by RemoteSendingHost order by Hits DESC" -i:CSV -nSkipLines:4 -o:CHART -chartType:PieExploded3D -chartTitle:"TOP 10 senders"
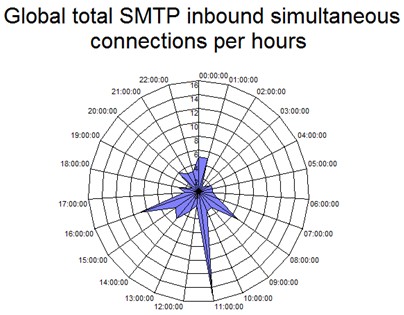
Next step is to be able to narrow on a specific time frame in your Exchange 2007 logs.
The table bellow provides the LP conversion expressions to use in order to manipulate the different date and time formats:
So far so good, but I can hear you say: "This is great but this is going to take forever on my productions logs so how do I optimize this?" One option is to filter by using the event field when it is equal to '+'. The '+' in the event field identifies a new connection so it will just happen once per SMTP connection. That being said this can still take some time especially if a lot of spammers are trying to hit the servers.
The sample bellow extracts top inbound connection filtered where event equals to '+' (as the plus sign means a new inbound connection):
logparser "select top 10 REVERSEDNS(EXTRACT_PREFIX(remote-endpoint,0,':')) as RemoteSendingHost, count(*) as Hits into topsender.gif from RECV*.LOG where event='+' group by RemoteSendingHost order by Hits DESC" -i:CSV -nSkipLines:4 -o:CHART -chartType:PieExploded3D -chartTitle:"TOP 10 senders"
Next step is to be able to narrow on a specific time frame in your Exchange 2007 logs.
The table bellow provides the LP conversion expressions to use in order to manipulate the different date and time formats:
|
Extracting |
Log Parser expression |
Format |
|
Date |
EXTRACT_PREFIX([#Fields: date-time],0,'T') |
YYYY-MM-DD |
|
Time |
EXTRACT_PREFIX(TO_STRING(EXTRACT_SUFFIX([#Fields: date-time],0,'T')),0,'.') |
HH:MM:SS |
|
Date & time |
TO_TIMESTAMP ( EXTRACT_PREFIX(TO_STRING([#Fields: date-time]),0,'.') , 'yyyy-mm-ddThh:mm:ss') |
TO_TIMESTAMP (Log Parser time stamp type) |
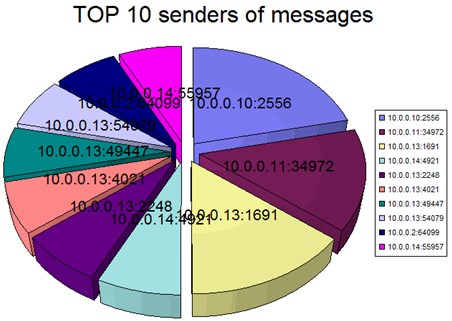
 Identifying top senders
Now let's say we want to identify our top senders. Top senders are usually referred to as senders that are sending the most messages.
So let's first build a query to output senders by where we at least started to "receive a message":
logparser "select top 10 remote-endpoint, count(*) as Hits into topsender-messages.gif from RECV*.LOG where context='receiving message' group by remote-endpoint order by Hits DESC" -i:CSV -nSkipLines:4 -o:CHART -chartType:PieExploded3D -chartTitle:"TOP 10 senders of messages"
Identifying top senders
Now let's say we want to identify our top senders. Top senders are usually referred to as senders that are sending the most messages.
So let's first build a query to output senders by where we at least started to "receive a message":
logparser "select top 10 remote-endpoint, count(*) as Hits into topsender-messages.gif from RECV*.LOG where context='receiving message' group by remote-endpoint order by Hits DESC" -i:CSV -nSkipLines:4 -o:CHART -chartType:PieExploded3D -chartTitle:"TOP 10 senders of messages"
 But this doesn't mean that all messages where 'accepted' because in one SMTP connection multiple SMTP messages can be sent but some can be accepted and other rejected.
If you dig into the Exchange logs you will find that the "signature" of an accepted message is as follows:
Data field starts with the following string: "250 2.6.0 <" and ends with the following string "Queued mail for delivery".
Sample query to dump all inbound queued mail for delivery:
logparser "select * from RECV*.log where (data like '%250 2.6.0 <%') and (data like '%Queued mail for delivery%')" -i:CSV -nSkipLines:4 -o:DATAGRID
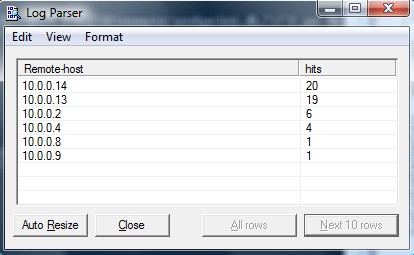
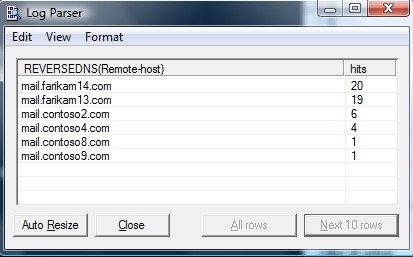
Now we can group by top senders of messages, note we are removing the port number because indeed a same host can connect multiple times in a day but using different remote source ports. Of course you can REVERSEDNS to identify (or at least getting started to identify) that is hiding behind the IPs:
logparser "select EXTRACT_PREFIX(remote-endpoint,0,':') as remote-host, count(*) as hits from RECV*.log where (data like '%250 2.6.0 <%') and (data like '%Queued mail for delivery%') group by remote-host order by hits DESC" -i:CSV -nSkipLines:4 -o:DATAGRID
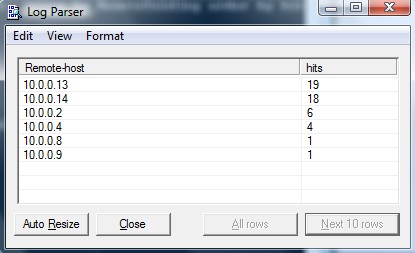
Identifying top email rejecting IP sources
Identifying top servers that you most reject mail from is helpful to help saving bandwidth.
If a server is sending mail that is very often rejected, that is very likely to help you identify potential spammers. Once these IP sources have been identified, they can be blocked at firewall level and will help against consuming bandwidth by unsolicited email. A manual check should be performed to make sure that the sending server is indeed a real offender.
Sample exchange log of unsolicited mail blocked by exchange that can be found in the data field:
But this doesn't mean that all messages where 'accepted' because in one SMTP connection multiple SMTP messages can be sent but some can be accepted and other rejected.
If you dig into the Exchange logs you will find that the "signature" of an accepted message is as follows:
Data field starts with the following string: "250 2.6.0 <" and ends with the following string "Queued mail for delivery".
Sample query to dump all inbound queued mail for delivery:
logparser "select * from RECV*.log where (data like '%250 2.6.0 <%') and (data like '%Queued mail for delivery%')" -i:CSV -nSkipLines:4 -o:DATAGRID
Now we can group by top senders of messages, note we are removing the port number because indeed a same host can connect multiple times in a day but using different remote source ports. Of course you can REVERSEDNS to identify (or at least getting started to identify) that is hiding behind the IPs:
logparser "select EXTRACT_PREFIX(remote-endpoint,0,':') as remote-host, count(*) as hits from RECV*.log where (data like '%250 2.6.0 <%') and (data like '%Queued mail for delivery%') group by remote-host order by hits DESC" -i:CSV -nSkipLines:4 -o:DATAGRID
Identifying top email rejecting IP sources
Identifying top servers that you most reject mail from is helpful to help saving bandwidth.
If a server is sending mail that is very often rejected, that is very likely to help you identify potential spammers. Once these IP sources have been identified, they can be blocked at firewall level and will help against consuming bandwidth by unsolicited email. A manual check should be performed to make sure that the sending server is indeed a real offender.
Sample exchange log of unsolicited mail blocked by exchange that can be found in the data field:
550 5.7.1 Message rejected due to content restrictionsIdentifying top rejected senders would look like this: logparser "select EXTRACT_PREFIX(remote-endpoint,0,':') as Remote-host, count (*) as hits from RECV*.log where data like '%rejected%' group by Remote-host order by hits desc" -i:CSV -nSkipLines:4 -o:DATAGRID
 As you can see in the example above the same sender 10.0.0.x as multiple outbound hosts that seem to be on the same C class...
A wider interesting search would be to look at 550 return codes:
logparser "select * from RECV*.log where data like '%550 %'" -i:CSV -nSkipLines:4 -o:DATAGRID
As you can see in the example above the same sender 10.0.0.x as multiple outbound hosts that seem to be on the same C class...
A wider interesting search would be to look at 550 return codes:
logparser "select * from RECV*.log where data like '%550 %'" -i:CSV -nSkipLines:4 -o:DATAGRID
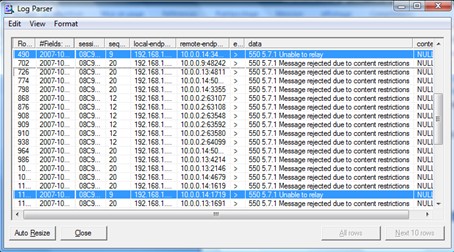 As you can see from results of that, 550's are also valid for relay attempts.
So the following query will help you identify both mail rejection and senders trying to relay through your mail system:
logparser "select EXTRACT_PREFIX(remote-endpoint,0,':') as Remote-host, count (*) as hits from RECV*.log where data like '%550 %' group by Remote-host order by hits desc" -i:CSV -nSkipLines:4 -o:DATAGRID
As you can see from results of that, 550's are also valid for relay attempts.
So the following query will help you identify both mail rejection and senders trying to relay through your mail system:
logparser "select EXTRACT_PREFIX(remote-endpoint,0,':') as Remote-host, count (*) as hits from RECV*.log where data like '%550 %' group by Remote-host order by hits desc" -i:CSV -nSkipLines:4 -o:DATAGRID
 Note if you don't see any "Unable to relay" attempts in your logs it is very likely that:
- You have a smarthost upfront blocking beforehand and may relay attempts.Or
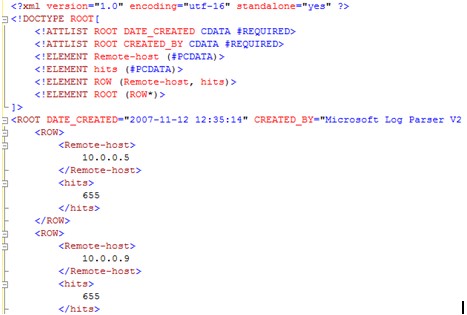
- That your server is indeed relaying mail.There are other 500's types of status codes such as 504, 535 and so on. The most effective query I have found is to catch all numeric numbers above 500. The LP query would look like this: logparser "select * from RECV*.log where TO_INT( SUBSTR(DATA,0,3)) > 500 and event = '>'" -i:CSV -nSkipLines:4 -o:DATAGRID Then, the ultimate group by query would be: logparser "select EXTRACT_PREFIX(remote-endpoint,0,':') as Remote-host, count (*) as hits from RECV*.log where TO_INT( SUBSTR(DATA,0,3)) > 500 and event = '>' group by Remote-host order by hits desc" -i:CSV -nSkipLines:4 -o:DATAGRID You can use the REVERSEDNS function on top of that. If you see IP address returned instead of a FQDN, it is even more likely that these hosts are really offenders because they didn't provide a reverse PTR record. But again - doing a reversedns function on huge logs would be slow. The best approach I have come up with to work around that is in two phases: 1. As shown above, identify the list of suspicious senders with the query and dump the output to a temporary log file such as the following: logparser "select EXTRACT_PREFIX(remote-endpoint,0,':') as Remote-host, count (*) as hits into SuspiciousSenders.xml from RECV*.log where TO_INT( SUBSTR(DATA,0,3)) > 500 and event = '>' group by Remote-host order by hits desc" -i:CSV -nSkipLines:4 -o:XML 2. You can then load the XML generated file as below and apply the REVERSEDNS only on the "hotspot" (top senders): logparser "select REVERSEDNS(Remote-host), hits from SuspiciousSenders.xml" -i:XML -o:DATAGRID You can then select the top 10 and first investigate those: logparser "select top 10 REVERSEDNS(Remote-host), hits from SuspiciousSenders.xml" -i:XML -o:DATAGRID
 Identifying outbound email issues
As we have mentioned previously, outbound SMTP log is located in: ProtocolLog\SmtpSend.
If we want to identify outbound status codes we first need to parse the data field to identify if the remote host has accepted our messages and as the Data field is a string we also need to convert it to an "int" (intger) type:
logparser "select case TO_INT( SUBSTR(DATA,0,3)) when NULL then 0 else TO_INT( SUBSTR(DATA,0,3)) end as RemoteHostReturnCode from SEND*.log " -i:CSV -nSkipLines:4 -o:DATAGRID
We are filtering status codes above 400 as we want to have both deferred and rejected emails. For rejected emails only you can filter at 500.
So getting detailed information of outbound issues would look like this:
logparser "select EXTRACT_PREFIX(remote-endpoint,0,':') as Remote-host, data, context, case TO_INT( SUBSTR(DATA,0,3)) when NULL then 0 else TO_INT( SUBSTR(DATA,0,3)) end as RemoteHostReturnCode from SEND*.log where RemoteHostReturnCode > 400" -i:CSV -nSkipLines:4 -o:DATAGRID
That being said, the above might get some false positives so a better query looks like this:
logparser "select TO_TIMESTAMP ( EXTRACT_PREFIX(TO_STRING([#Fields: date-time]),0,'.'), 'yyyy-mm-ddThh:mm:ss') as DateTime, EXTRACT_PREFIX(remote-endpoint,0,':') as Remote-host, data, context, case TO_INT( SUBSTR(DATA,0,3)) when NULL then 0 else TO_INT(SUBSTR(DATA,0,3)) end as RemoteHostReturnCode from SEND*.log where RemoteHostReturnCode > 400 and context <> 'Certificate thumbprint' and context <> 'sending message'" -i:CSV -nSkipLines:4 -o:DATAGRID
Now again you can use the two step approach as mentioned above to dump the results into an .XML log file:
logparser "select EXTRACT_PREFIX(remote-endpoint,0,':') as Remote-host, count(*) as hits into SendingIssues.xml from SEND*.log where TO_INT( SUBSTR(DATA,0,3)) > 400 and context <> 'Certificate thumbprint' and context <> 'sending message' group by Remote-host order by hits desc" -i:CSV -nSkipLines:4 -o:XML
Identifying outbound email issues
As we have mentioned previously, outbound SMTP log is located in: ProtocolLog\SmtpSend.
If we want to identify outbound status codes we first need to parse the data field to identify if the remote host has accepted our messages and as the Data field is a string we also need to convert it to an "int" (intger) type:
logparser "select case TO_INT( SUBSTR(DATA,0,3)) when NULL then 0 else TO_INT( SUBSTR(DATA,0,3)) end as RemoteHostReturnCode from SEND*.log " -i:CSV -nSkipLines:4 -o:DATAGRID
We are filtering status codes above 400 as we want to have both deferred and rejected emails. For rejected emails only you can filter at 500.
So getting detailed information of outbound issues would look like this:
logparser "select EXTRACT_PREFIX(remote-endpoint,0,':') as Remote-host, data, context, case TO_INT( SUBSTR(DATA,0,3)) when NULL then 0 else TO_INT( SUBSTR(DATA,0,3)) end as RemoteHostReturnCode from SEND*.log where RemoteHostReturnCode > 400" -i:CSV -nSkipLines:4 -o:DATAGRID
That being said, the above might get some false positives so a better query looks like this:
logparser "select TO_TIMESTAMP ( EXTRACT_PREFIX(TO_STRING([#Fields: date-time]),0,'.'), 'yyyy-mm-ddThh:mm:ss') as DateTime, EXTRACT_PREFIX(remote-endpoint,0,':') as Remote-host, data, context, case TO_INT( SUBSTR(DATA,0,3)) when NULL then 0 else TO_INT(SUBSTR(DATA,0,3)) end as RemoteHostReturnCode from SEND*.log where RemoteHostReturnCode > 400 and context <> 'Certificate thumbprint' and context <> 'sending message'" -i:CSV -nSkipLines:4 -o:DATAGRID
Now again you can use the two step approach as mentioned above to dump the results into an .XML log file:
logparser "select EXTRACT_PREFIX(remote-endpoint,0,':') as Remote-host, count(*) as hits into SendingIssues.xml from SEND*.log where TO_INT( SUBSTR(DATA,0,3)) > 400 and context <> 'Certificate thumbprint' and context <> 'sending message' group by Remote-host order by hits desc" -i:CSV -nSkipLines:4 -o:XML
 And then group by and "reversedns" on it:
logparser "select REVERSEDNS(Remote-host), hits from SendingIssues.xml" -i:XML -o:DATAGRID
Based on the above queries, the following one will build a table of top rejection errors by type and number of hits:
logparser "select case TO_INT( SUBSTR(DATA,0,3)) when NULL then 0 else TO_INT( SUBSTR(DATA,0,3)) end as RemoteHostReturnCode, data, count (*) as hits from SEND*.log where RemoteHostReturnCode > 400 and context <> 'Certificate thumbprint' and context <> 'sending message' group by RemoteHostReturnCode, data order by hits desc" -i:CSV -nSkipLines:4 -o:DATAGRID
And then group by and "reversedns" on it:
logparser "select REVERSEDNS(Remote-host), hits from SendingIssues.xml" -i:XML -o:DATAGRID
Based on the above queries, the following one will build a table of top rejection errors by type and number of hits:
logparser "select case TO_INT( SUBSTR(DATA,0,3)) when NULL then 0 else TO_INT( SUBSTR(DATA,0,3)) end as RemoteHostReturnCode, data, count (*) as hits from SEND*.log where RemoteHostReturnCode > 400 and context <> 'Certificate thumbprint' and context <> 'sending message' group by RemoteHostReturnCode, data order by hits desc" -i:CSV -nSkipLines:4 -o:DATAGRID
|
RemoteHostReturnCode |
Data |
Hits |
|
554 |
554- (RTR:DU) http://postmaster.contoso.com/errors/yyy.html |
1595 |
|
550 |
550 Desole votre serveur de messagerie etant identifie comme generateur de messages non sollicites. Votre message ne peut etre delivre. Veuillez contacter votre administrateur systeme. |
653 |
|
451 |
451 Message temporarily deferred - [160] |
563 |
|
421 |
421 Message from (mail.contoso.com) temporarily deferred - 4.16.50. Please refer to http://mail.contoso.com/defer.html |
498 |
|
550 |
550 DY-001 Mail rejected by this domain for policy reasons. |
223 |
|
550 |
550-5.7.1 [mail.contoso.com] The IP you're using to send email is not authorized |
206 |
|
550 |
550-5.7.1 To send email directly to our servers please use.. |
198 |
|
550 |
550 5.7.1 Service unavailable; Client host [mail.contoso.com] blocked |
187 |
|
554 |
554 TRANSACTION FAILED |
108 |
|
554 |
554-: (RTR:GE) http:// postmaster.contoso.com/errors/yyy.html |
78 |
|
550 |
550 Mail rejected. Contact your ISP to determine which authorized SMTP relay servers to send your mail through (or) request a static and dedicated IP before attempting to send mail. |
76 |
|
502 |
502 Error: command not implemented |
1 |
|
550 |
550 5.7.1 Rejected: mail.contoso.com listed as spam source |
1 |
|
Field |
Most useful (in our examples) |
|
Timestamp |
x |
|
SessionId |
|
|
LocalEndpoint |
|
|
RemoteEndpoint |
x |
|
EnteredOrgFromIP |
x |
|
MessageId |
|
|
P1FromAddress |
x |
|
P2FromAddresses |
x |
|
Recipient |
x |
|
NumRecipients |
x |
|
Agent |
|
|
Event |
|
|
Action |
|
|
SmtpResponse |
x |
|
Reason |
x |
|
ReasonData |
x |
- 0 is accepted content
- Everything else is rejected contentThis gives a great idea of the amount of rejected mail by a server. Message tracking log This log is self explanatory and is the best place to look at when one is trying to understand what goes in and out of the system, especially when multiple routing connectors are available. It also keeps tracks of all message subjects that go through the server. So when message routing or history is in question, this is the place to go to. Again same LP base line query applies: logparser "select * from AGENT*.log " -i:CSV -nSkipLines:4 -o:DATAGRID
|
Field |
Most useful (in our examples) |
|
date-time |
x |
|
client-ip |
x |
|
client-hostname |
|
|
server-ip |
x |
|
server-hostname |
|
|
source-context |
x |
|
connector-id |
|
|
source |
x |
|
event-id |
|
|
internal-message-id |
|
|
message-id |
|
|
recipient-address |
x |
|
recipient-status |
|
|
total-bytes |
x |
|
recipient-count |
|
|
related-recipient-address |
|
|
reference |
|
|
message-subject |
x |
|
sender-address |
|
|
return-path |
x |
|
message-info |
|
You must be a registered user to add a comment. If you've already registered, sign in. Otherwise, register and sign in.