- Home
- Microsoft 365
- Excel
- Using data model and power pivots to link tables in Excel
Using data model and power pivots to link tables in Excel
- Subscribe to RSS Feed
- Mark Discussion as New
- Mark Discussion as Read
- Pin this Discussion for Current User
- Bookmark
- Subscribe
- Printer Friendly Page
- Mark as New
- Bookmark
- Subscribe
- Mute
- Subscribe to RSS Feed
- Permalink
- Report Inappropriate Content
May 27 2023 03:18 AM
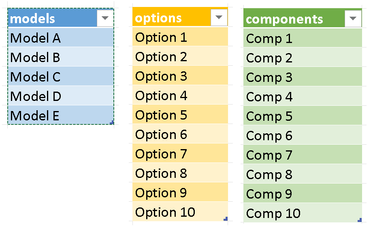
I have three tabs, each with a simple one column table, named respectively, Models, Options, Components. The rows in each table consist of the unique names of the product models, options and components.
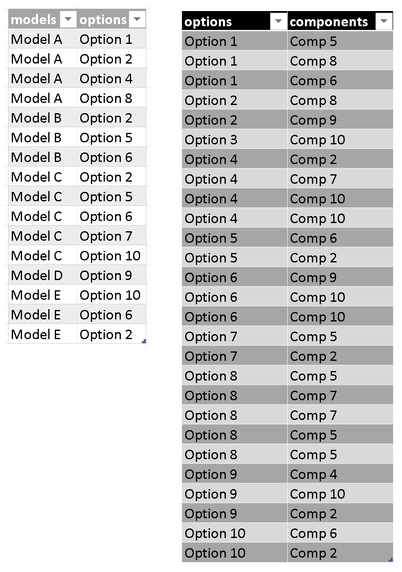
I have another two tabs, each with a table with two columns that maps various options to each model, and various components to each option respectively.
I have added all five tables to the data model and created relationships between the columns with common names (ie model in the Models table and model in the Options to Models mapping table etc).

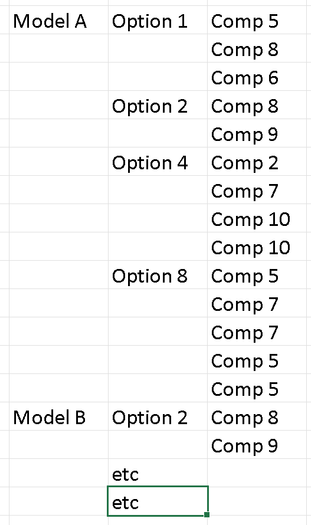
I would like to be able to create a pivot table that lists all the models, along with the options that are mapped to that model, and the components that are mapped to those options. Ultimately, it might look something like this:

I have tried creating a pivot table from the data model, but when I add the models, options and components fields to Rows, it shows ALL options for each model and ALL components for each option, rather than just the mapped ones.
Can anyone please tell me where I am going wrong?
Thanks.
- Labels:
-
Excel
-
Office 365
- Mark as New
- Bookmark
- Subscribe
- Mute
- Subscribe to RSS Feed
- Permalink
- Report Inappropriate Content
May 27 2023 05:54 AM
SolutionIn any case we need to add some aggregation to PivotTable, otherwise that always will be full join. Let do for number of components. Relationships could be as
and for models <-> options we may use virtual relationship
# of Components:=CALCULATE (
    COUNTROWS ( options_components ),
    TREATAS ( VALUES ( models_options[options] ), Options[options] )
)
Result is
- Mark as New
- Bookmark
- Subscribe
- Mute
- Subscribe to RSS Feed
- Permalink
- Report Inappropriate Content
May 28 2023 04:28 PM
Thank you so much for taking the time to give me such a detailed response. I really appreciate your help.
One quick follow-up question. For the models <-> options relationship, is there a reason you opted for a virtual relationship instead of creating the relationship by selecting the common fields in diagram view?
Thanks again.
- Mark as New
- Bookmark
- Subscribe
- Mute
- Subscribe to RSS Feed
- Permalink
- Report Inappropriate Content
May 29 2023 02:14 PM
From Models you may filter options in models_options, but from here we can filter options in Options. Filter-up from many-to-one doesn't work.
For that we need to have bi-directional relationship which is supported in Power BI Desktop, but not in Excel.
Alternatively we may use virtual relationships or use CROSSFILTER like
# of Components CF :=
CALCULATE (
    COUNTROWS ( options_components ),
    CROSSFILTER ( models_options[options], Options[options], BOTH )
)
For more details you may google for "dax bi-directional" or so, first I found Many to Many Relationships in DAX Explained - Excelerator BI
Accepted Solutions
- Mark as New
- Bookmark
- Subscribe
- Mute
- Subscribe to RSS Feed
- Permalink
- Report Inappropriate Content
May 27 2023 05:54 AM
SolutionIn any case we need to add some aggregation to PivotTable, otherwise that always will be full join. Let do for number of components. Relationships could be as
and for models <-> options we may use virtual relationship
# of Components:=CALCULATE (
    COUNTROWS ( options_components ),
    TREATAS ( VALUES ( models_options[options] ), Options[options] )
)
Result is


