- Home
- Microsoft 365
- Excel
- Re: Tabular Pivot Table with Excel Lambda and new array functions
Tabular Pivot Table with Excel Lambda and new array functions
- Subscribe to RSS Feed
- Mark Discussion as New
- Mark Discussion as Read
- Pin this Discussion for Current User
- Bookmark
- Subscribe
- Printer Friendly Page
- Mark as New
- Bookmark
- Subscribe
- Mute
- Subscribe to RSS Feed
- Permalink
- Report Inappropriate Content
Aug 29 2022 11:56 AM - edited Aug 29 2022 11:57 AM
Hello everyone,
I've been learning and practicing Lambda helper functions for the last few months and I'm amazed by advanced techniques, especially with those that handle arrays of arrays - @Peter Bartholomew's thunks and @Sergei Baklan's magic solution DROP/REDUCE/VSTACK.
I need a little help with a problem that seems simpler than that.
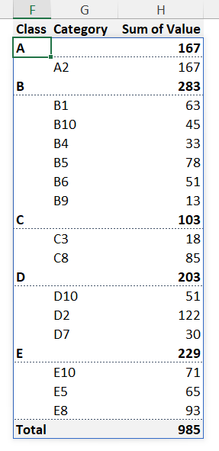
How can we replicate a tabular pivot table using Excel's new set of functions in the most efficient way and one single formula?
I have attached a simple example containing two columns of hierarchized categories and one of values that must be added up.
Thanks in advance!
- Labels:
-
Excel
-
Formulas and Functions
-
Office 365
- Mark as New
- Bookmark
- Subscribe
- Mute
- Subscribe to RSS Feed
- Permalink
- Report Inappropriate Content
Aug 29 2022 01:40 PM
This is intended as a 'starter for one' to allow for further refinement. Because your data is hierarchical and the Category starts the class as its first character, it is only necessary to work with the category.
The basic ways of getting conditional sums are to use SUMIFS over the source data or to FILTER the data and sum each category.
= LET(
    category, SORT(UNIQUE(Data[Category])),
    sumValue, SUMIFS(Data[Value], Data[Category], category),
    HSTACK(category, sumValue)
  )
Alternatively
= LET(
    category, SORT(UNIQUE(Data[Category])),
    sumValue, MAP(category, LAMBDA(cat,
      SUM(FILTER(Data[Value], Data[Category]= cat)))
    ),
    HSTACK(category, sumValue)
  )
Many refinements are possible but it is up to you to decide what is important. For example interlacing subtotals presents a bit of a challenge but may not be needed.
- Mark as New
- Bookmark
- Subscribe
- Mute
- Subscribe to RSS Feed
- Permalink
- Report Inappropriate Content
Aug 29 2022 01:53 PM
The example has categories that start with the class letter, but this will not be the case in my real case application.
- Mark as New
- Bookmark
- Subscribe
- Mute
- Subscribe to RSS Feed
- Permalink
- Report Inappropriate Content
Aug 29 2022 03:09 PM
SolutionThis might explain my hesitance getting involved with issues of layout!
= LET(
    wildcards,      IFNA(HSTACK(UNIQUE(Data[Class]), "*"),"*"),
    distinct,       SORT(VSTACK(wildcards, UNIQUE(Data[[Class]:[Category]])),{1,2}),
    class,          CHOOSECOLS(distinct,1),
    category,       CHOOSECOLS(distinct,2),
    sumValue,       SUMIFS(Data[Value], Data[Class], class, Data[Category], category),
    outputClass,    IF(category="*", class, ""),
    outputCategory, IF(category<>"*", category, ""),
    output,         HSTACK(outputClass, outputCategory, sumValue),
    totalrow,       HSTACK("Total", "", SUM(Data[Value])),
    VSTACK(output, totalrow)
)- Mark as New
- Bookmark
- Subscribe
- Mute
- Subscribe to RSS Feed
- Permalink
- Report Inappropriate Content
Aug 29 2022 05:47 PM
Accepted Solutions
- Mark as New
- Bookmark
- Subscribe
- Mute
- Subscribe to RSS Feed
- Permalink
- Report Inappropriate Content
Aug 29 2022 03:09 PM
SolutionThis might explain my hesitance getting involved with issues of layout!
= LET(
    wildcards,      IFNA(HSTACK(UNIQUE(Data[Class]), "*"),"*"),
    distinct,       SORT(VSTACK(wildcards, UNIQUE(Data[[Class]:[Category]])),{1,2}),
    class,          CHOOSECOLS(distinct,1),
    category,       CHOOSECOLS(distinct,2),
    sumValue,       SUMIFS(Data[Value], Data[Class], class, Data[Category], category),
    outputClass,    IF(category="*", class, ""),
    outputCategory, IF(category<>"*", category, ""),
    output,         HSTACK(outputClass, outputCategory, sumValue),
    totalrow,       HSTACK("Total", "", SUM(Data[Value])),
    VSTACK(output, totalrow)
 )
