- Subscribe to RSS Feed
- Mark Discussion as New
- Mark Discussion as Read
- Pin this Discussion for Current User
- Bookmark
- Subscribe
- Printer Friendly Page
- Mark as New
- Bookmark
- Subscribe
- Mute
- Subscribe to RSS Feed
- Permalink
- Report Inappropriate Content
Jul 13 2020 01:42 AM
Hi, I'm trying to build a pivot table out of the attached data. The data is in the first tab, and the attempt at the table is in the second.
I'm having trouble:
a) Ordering the tasks Task 1 , 2 , 3 etc in order, and
b) I'd like to add the dates with the total value into columns in both quarters and year, and
c) I inherited the spreadsheet (its much bigger than the excerpt here) and note that there is a hidden formula/macro that turns cells green whre it fills the criteria of having work done that week for that development service. I cant seem to uncover the formula/macro that does this - is there some way to do this?
If that makes sense?
Thank you
- Labels:
-
Excel
- Mark as New
- Bookmark
- Subscribe
- Mute
- Subscribe to RSS Feed
- Permalink
- Report Inappropriate Content
Jul 13 2020 03:06 AM
Q1: Your task names are text. Hence, "Task 10" gets sorted before "Task 2". Add a 0 before single digit task numbers. Then "Task 02" will be sorted before "Task 10".
Q2: Your data is already "pivoted". It needs to be "unpivoted" first, so that you can put the dates in column headers and then group them by Qtr and Year. Use "Get&Transform Data" (a.k.a. as PowerQuery PQ) and PowerPivot to achieve this.
Q3: The colouring of cells depending on criteria is done via Conditional Formatting.
The attached workbook has Q1 and Q2 resolved, though you may find the steps mentioned in Q2 not all that straight-forward. Especially if you have never work with PQ before. First, determine if the outcome is what you need. Next, see if/how you can implement this in your real life situation.
- Mark as New
- Bookmark
- Subscribe
- Mute
- Subscribe to RSS Feed
- Permalink
- Report Inappropriate Content
Jul 13 2020 03:30 AM
@Riny_van_Eekelen Thankyou! I will have a look. Regards. Julian
- Mark as New
- Bookmark
- Subscribe
- Mute
- Subscribe to RSS Feed
- Permalink
- Report Inappropriate Content
Jul 13 2020 04:03 AM
Riny,
Hi, I've had a look and recreated the table, thanks.
I was wondering about the date format you used in the columns though - did you have to do this for the data to sort in the PT in the correct year order?
also, and thank you for your patience! would there be an easy way to group this by month as well as quarters and years?
Regards
Julian
- Mark as New
- Bookmark
- Subscribe
- Mute
- Subscribe to RSS Feed
- Permalink
- Report Inappropriate Content
Jul 13 2020 05:50 AM
Solution@JulianG950 Regarding the date format, it doesn't have to be a special one. As long as the dates have a data type "Date". Then, you can group them e.g. by year, quarter, month.
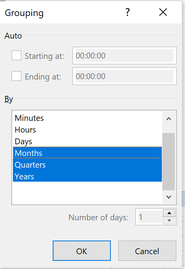
Grouping is done by selecting a date header in the PT and then "Group selection" in the "PivotTable Analyse" ribbon.

and then the grouping that you want.
Give it a try and come back if you run into troubles.
- Mark as New
- Bookmark
- Subscribe
- Mute
- Subscribe to RSS Feed
- Permalink
- Report Inappropriate Content
Jul 13 2020 11:44 PM
@Riny_van_Eekelen Hi, thanks for the advice. Think I've got it, took a little while as I was highlighting all the dates not one, to do the grouping.
Your help is appreciated.
Regards
Julian
Accepted Solutions
- Mark as New
- Bookmark
- Subscribe
- Mute
- Subscribe to RSS Feed
- Permalink
- Report Inappropriate Content
Jul 13 2020 05:50 AM
Solution@JulianG950 Regarding the date format, it doesn't have to be a special one. As long as the dates have a data type "Date". Then, you can group them e.g. by year, quarter, month.
Grouping is done by selecting a date header in the PT and then "Group selection" in the "PivotTable Analyse" ribbon.

and then the grouping that you want.
Give it a try and come back if you run into troubles.
