- Home
- Microsoft 365
- Excel
- Overlapping Secondary Axis With Scatter Plot with Smooth Lines
Overlapping Secondary Axis With Scatter Plot with Smooth Lines
- Subscribe to RSS Feed
- Mark Discussion as New
- Mark Discussion as Read
- Pin this Discussion for Current User
- Bookmark
- Subscribe
- Printer Friendly Page
- Mark as New
- Bookmark
- Subscribe
- Mute
- Subscribe to RSS Feed
- Permalink
- Report Inappropriate Content
Mar 31 2023 09:01 PM
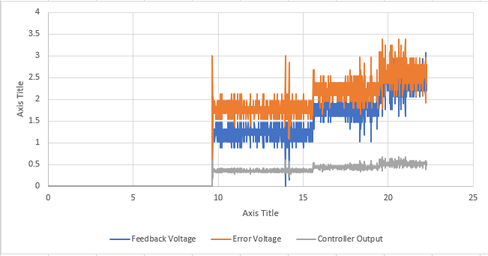
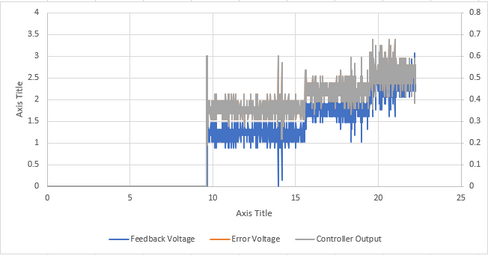
I am trying to plot 3 sets of data against one x-axis. One of the sets of data I want to give a secondary axis, however, every time I try to do this it moves it right over top of one of my other sets of data so it is unviewable. I managed to do this with another graph for different sets of data and it moved the secondary axis into the middle of the graph so that they mirrored each other. The only problem is that in this other graph it had a slightly different set of values for the x-axis that I used, whereas the current graph I am creating doesn't have this. I have looked online for another work around, however, every solution I have found uses bar graphs so this doesn't work for my graph. I have attached pictures below to better show my problem. Thank you to anyone who has any suggestions!
Without plotting the Controller Output on the Secondary Axis.
With the Controller Output on the Secondary Axis
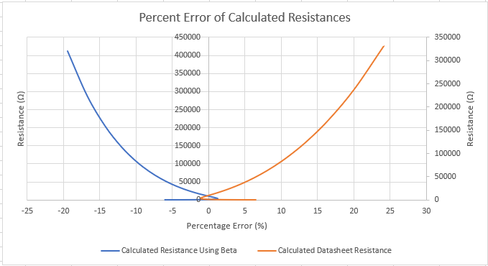
This is what I want to have my graph look like.
- Labels:
-
Excel
-
Office 365


