- Home
- Microsoft 365
- Excel
- Re: Identify top 80% revenue with multiple criteria
Identify top 80% revenue with multiple criteria
- Subscribe to RSS Feed
- Mark Discussion as New
- Mark Discussion as Read
- Pin this Discussion for Current User
- Bookmark
- Subscribe
- Printer Friendly Page
- Mark as New
- Bookmark
- Subscribe
- Mute
- Subscribe to RSS Feed
- Permalink
- Report Inappropriate Content
Mar 08 2022 05:27 PM - edited Mar 08 2022 06:05 PM
Hi All,
I am totally stumped. I have a sales data set that I am working with with multiple unique criteria. roughly 1500 lines/SKUs that make up about 10 categories, 30 classes and 5 sizes. All with unique revenues.
E.g. Category: Food Class: Spices Size: 1g total revenue: $100,000, total lines 37
First I am trying to find the SKUs that generated the top 80% (or close to) of revenue of the matching groups for category, class and size. Summing largest values to smallest values. Once that data has been identified I want to return the MIN of the values making up that 80%?
Does anyone know of a formula(s) or a technique that may work for this type of situation. The goal is to remove the manual filtering that I am currently doing to identify the min top 80% value.
Thank you in advanced.
- Labels:
-
BI & Data Analysis
-
Excel
- Mark as New
- Bookmark
- Subscribe
- Mute
- Subscribe to RSS Feed
- Permalink
- Report Inappropriate Content
Mar 09 2022 06:23 AM
Hi @BK_Bangkok
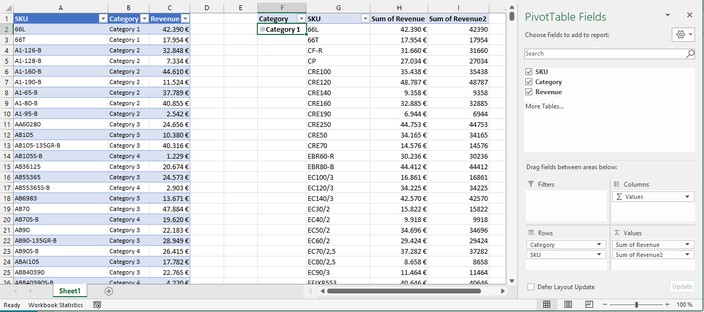
I guess this should be possible with a pivot table:
Put the category and SKU's in the rows range (I just use a simplified example)
Put the revenue in the values range
Put the revenue a second time in the values range.
Sort the SKU field descending by revenue:
Then put a values filter on SKU:
Change the value field settings on the second revenue field:
Chose "Rank Smallest to Largest" based on SKU field:
Then, your pivot table just shows the top 80% and you see also the rank (in revenue2). As the table is already sorted by revenue, the rank is not really necessary, but it helps if you change the sorting.


