- Home
- Microsoft 365
- Excel
- How to find the relationship between a few sets of data
How to find the relationship between a few sets of data
- Subscribe to RSS Feed
- Mark Discussion as New
- Mark Discussion as Read
- Pin this Discussion for Current User
- Bookmark
- Subscribe
- Printer Friendly Page
- Mark as New
- Bookmark
- Subscribe
- Mute
- Subscribe to RSS Feed
- Permalink
- Report Inappropriate Content
May 22 2023 03:30 PM
Bare with me, this is an Excel question...
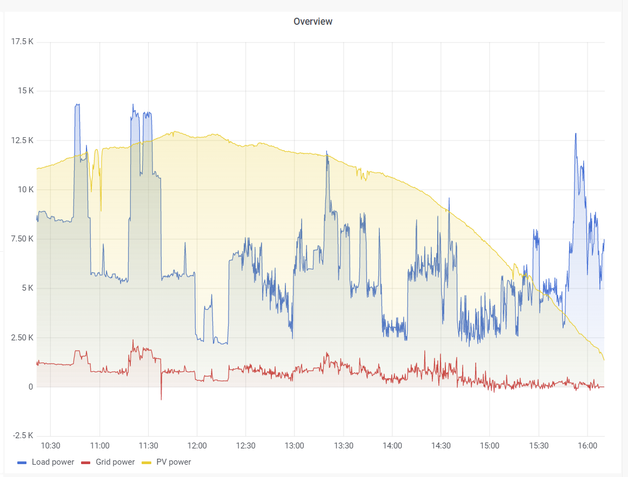
My inverters are drawing power from the grid when they shouldn't. I've got data for a few hours when PV was active. I've noticed that the grid draw seems to have some sort of relationship between the load and PV power while the battery is being charged.
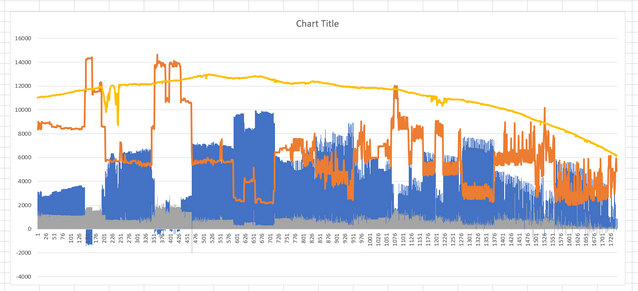
I have four sets of data: Load, Grid, PV, Battery. Best I could get done was sticking them in an Excel graph:
I can SEE a relationship where as the PV moves (and battery is charged) the draw from grid seems to match my load with some relation to PV. If I can figure out the relationship I can better understand what exactly is causing this strange draw from the grid. How this is done... I haven't a clue. Any help would be appreciated. Thanks!

