Turn on suggestions
Auto-suggest helps you quickly narrow down your search results by suggesting possible matches as you type.
- Home
- Microsoft 365
- Excel
- How to Create a Graph with Two sets of Ranges
How to Create a Graph with Two sets of Ranges
Discussion Options
- Subscribe to RSS Feed
- Mark Discussion as New
- Mark Discussion as Read
- Pin this Discussion for Current User
- Bookmark
- Subscribe
- Printer Friendly Page
- Mark as New
- Bookmark
- Subscribe
- Mute
- Subscribe to RSS Feed
- Permalink
- Report Inappropriate Content
Apr 11 2022 02:11 AM
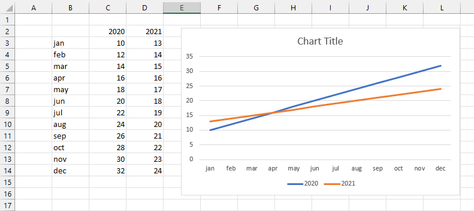
I want to create a graph in Excel where in I want plot a range of Prices from Jan to Dec 2020 and then also plot the range of the prices for the same item from Jan to Dec 2021 in the same Graph.
Kindly advise.
Labels:
- Labels:
-
Excel
2 Replies
- Mark as New
- Bookmark
- Subscribe
- Mute
- Subscribe to RSS Feed
- Permalink
- Report Inappropriate Content
Apr 11 2022 02:20 AM
- Mark as New
- Bookmark
- Subscribe
- Mute
- Subscribe to RSS Feed
- Permalink
- Report Inappropriate Content
May 26 2022 03:41 AM
Hi @Atanu1000
I attached a sample image of a double bar graph. Data refresh in chart automatically as you change your data selection.
You can check here for Microsoft Excel & Office 365.
And if you are comfortable with Google Sheets, you can find it here.
Thanks

