Turn on suggestions
Auto-suggest helps you quickly narrow down your search results by suggesting possible matches as you type.
Discussion Options
- Subscribe to RSS Feed
- Mark Discussion as New
- Mark Discussion as Read
- Pin this Discussion for Current User
- Bookmark
- Subscribe
- Printer Friendly Page
- Mark as New
- Bookmark
- Subscribe
- Mute
- Subscribe to RSS Feed
- Permalink
- Report Inappropriate Content
Jan 22 2022 08:43 AM
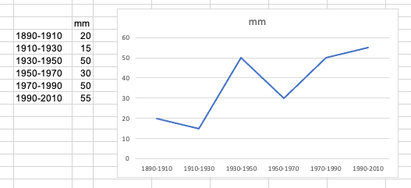
I am trying to graph a date range (1890-1910, 1910-2010, and so on) on the x-axis and measurements on the y-axis. However, every time I do this the dates do not work on the x-axis. I have tried to rearrange the data to match what I was describing I wanted earlier, but this still did not work the way I wanted.
Labels:
- Labels:
-
Charting
-
Excel
-
Excel on Mac
5 Replies
- Mark as New
- Bookmark
- Subscribe
- Mute
- Subscribe to RSS Feed
- Permalink
- Report Inappropriate Content
Jan 22 2022 09:10 AM
that is because "20mm" is TEXT and not a numeric value. Convert that column to be just the numbers: 20, 15, 50, ... and try again
- Mark as New
- Bookmark
- Subscribe
- Mute
- Subscribe to RSS Feed
- Permalink
- Report Inappropriate Content
Jan 22 2022 09:15 AM
Thank you! this solved the problem of it not graphing. Now, I have the problem of the x-axis showing 0-7 instead of the proper years. (I am sorry I am new to excel).
best response confirmed by
Nateman123 (Copper Contributor)
- Mark as New
- Bookmark
- Subscribe
- Mute
- Subscribe to RSS Feed
- Permalink
- Report Inappropriate Content
- Mark as New
- Bookmark
- Subscribe
- Mute
- Subscribe to RSS Feed
- Permalink
- Report Inappropriate Content
- Mark as New
- Bookmark
- Subscribe
- Mute
- Subscribe to RSS Feed
- Permalink
- Report Inappropriate Content
1 best response
Accepted Solutions
best response confirmed by
Nateman123 (Copper Contributor)
- Mark as New
- Bookmark
- Subscribe
- Mute
- Subscribe to RSS Feed
- Permalink
- Report Inappropriate Content
Jan 22 2022 09:16 AM
Solution
