- Home
- Microsoft 365
- Excel
- Re: Forecast for the remainder of the year 2022
Forecast for the remainder of the year 2022
- Subscribe to RSS Feed
- Mark Discussion as New
- Mark Discussion as Read
- Pin this Discussion for Current User
- Bookmark
- Subscribe
- Printer Friendly Page
- Mark as New
- Bookmark
- Subscribe
- Mute
- Subscribe to RSS Feed
- Permalink
- Report Inappropriate Content
Sep 15 2022 08:33 PM
| Country | 2021 | 2022 | Change% |
| Australia | 160 | 294 | 83.75% |
| USA | 1510 | 1357 | -10.13% |
| France | 2357 | 3567 | 51.34% |
| Italy | 156 | 92 | -41.03% |
The 2021 Column contains the number of people registered on a website for each country and 2022 contains the same although 2022 is not a full year data, it is only until the 10th of September. How do I forecast value for the remainder of 2022 based on what it would look like at the end of December (i.e. 31st December, 2022)?
- Labels:
-
Excel
-
Formulas and Functions
- Mark as New
- Bookmark
- Subscribe
- Mute
- Subscribe to RSS Feed
- Permalink
- Report Inappropriate Content
Sep 15 2022 09:17 PM - edited Sep 15 2022 09:18 PM
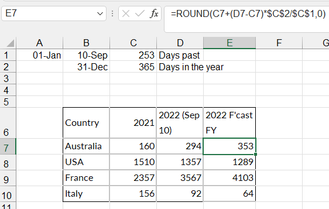
@Creedless_Soul Forecasting is all about assumptions. You could say that Australia increased by 134 during the fist 253 days of the year. If that growth trend continues you'll end up with 353 at the end of the year (160 + 134*365/253). In a formula, it would look like this:
file attached.
Alternatively, the 4th quarter may develop differently. Perhaps you can look back at what happened during the 4th quarter 2021 and use that as a basis to predict 2022. Or, if the growth in the past few weeks has been extreme that may continue (or not). Forecasting is not an exact science. It's all about assumptions :)
- Mark as New
- Bookmark
- Subscribe
- Mute
- Subscribe to RSS Feed
- Permalink
- Report Inappropriate Content
Sep 18 2022 05:03 PM
Used =ABS function to get a diff. between the new value and actual value and then added the absolute value to the 2022, Sep 10 value.
More methods to forecast would be helpful if anyone would like to share. Would love to know what other approaches could be used in this scenario.
