- Subscribe to RSS Feed
- Mark Discussion as New
- Mark Discussion as Read
- Pin this Discussion for Current User
- Bookmark
- Subscribe
- Printer Friendly Page
- Mark as New
- Bookmark
- Subscribe
- Mute
- Subscribe to RSS Feed
- Permalink
- Report Inappropriate Content
Jun 29 2020 01:20 AM
Hi,
I have a pivo table with two columns with date, start date and end date, I want to group by quarter on end date but the table groups by start date, how do I change it so it groups quarter on end date instead?
Thanks for any advise.
Claudia
- Labels:
-
Excel
- Mark as New
- Bookmark
- Subscribe
- Mute
- Subscribe to RSS Feed
- Permalink
- Report Inappropriate Content
Jun 29 2020 02:09 AM
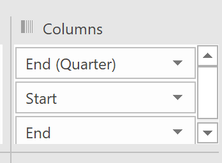
@ClaudiaM1 Perhaps like in the attached example? I grouped by Q2 and then dragged the new field "End (Quarter)" to the top of the list in the Columns area.
- Mark as New
- Bookmark
- Subscribe
- Mute
- Subscribe to RSS Feed
- Permalink
- Report Inappropriate Content
Jun 29 2020 02:34 AM
@Riny_van_Eekelen , Thank you for your answer, although I can't manage to change so that the source data for grouping quarterly retrieves data from end date instead of start date, see attached table.
- Mark as New
- Bookmark
- Subscribe
- Mute
- Subscribe to RSS Feed
- Permalink
- Report Inappropriate Content
Jun 29 2020 04:08 AM
@ClaudiaM1 Not being the user of the data, it's hard to imagine what you are trying to show, but perhaps the attache revised PT is what you need. If not, can you visualise how you would want the PT to look like?
- Mark as New
- Bookmark
- Subscribe
- Mute
- Subscribe to RSS Feed
- Permalink
- Report Inappropriate Content
Jun 29 2020 04:18 AM
- Mark as New
- Bookmark
- Subscribe
- Mute
- Subscribe to RSS Feed
- Permalink
- Report Inappropriate Content
Jun 29 2020 04:39 AM
@Riny_van_Eekelen Hi Riny again, just a quick question, if I want to show Quarter in the filter as label instead of SLUTDATUM (end date), as the revised PT you sent me, is this possible? is it also possible to show Start date and End date in headings as shown below?
- Mark as New
- Bookmark
- Subscribe
- Mute
- Subscribe to RSS Feed
- Permalink
- Report Inappropriate Content
- Mark as New
- Bookmark
- Subscribe
- Mute
- Subscribe to RSS Feed
- Permalink
- Report Inappropriate Content
Jun 29 2020 05:30 AM
- Mark as New
- Bookmark
- Subscribe
- Mute
- Subscribe to RSS Feed
- Permalink
- Report Inappropriate Content
- Mark as New
- Bookmark
- Subscribe
- Mute
- Subscribe to RSS Feed
- Permalink
- Report Inappropriate Content
Jun 30 2020 03:12 AM
@Riny_van_Eekelen Hi again, sorry to bother you ;) I wonder why my pivot table changes when I refresh data, It should only update data from data source but no change my output (filter and selection) ??
Regards
/Claudia
- Mark as New
- Bookmark
- Subscribe
- Mute
- Subscribe to RSS Feed
- Permalink
- Report Inappropriate Content
Jun 30 2020 06:12 AM
@ClaudiaM1 I suspect that Excel doesn't like that dates are grouped in the column area and that the the year and quarter components are then dragged to the filter area. As you have mentioned, it totally screws up the PT and graph upon refreshing.
Therefore, I added two columns to the data that calculate the year and quarter. Then, I rebuilt the PT. Now it remains filters and formatted upon refresh.
I trust you can reformat the PT and rebuild the graph yourself.
Har det bra!
- Mark as New
- Bookmark
- Subscribe
- Mute
- Subscribe to RSS Feed
- Permalink
- Report Inappropriate Content
Jun 30 2020 06:31 AM
@Riny_van_Eekelen Hi Riny!
Thank you! I couldn't figure out what was wrong, all the settings seemed to be correct and since I didn't group the dates in the column area myself I just couldn't figure it out. I guess that adding two new columns with year and month to data source is the best alternative, although it feels so odd that the pivot table can't handle dates being grouped? It feels like I always come across strange things in excel! :)
Thanks again!
Ha det bra!!
Kind regards
/Claudia
Accepted Solutions
- Mark as New
- Bookmark
- Subscribe
- Mute
- Subscribe to RSS Feed
- Permalink
- Report Inappropriate Content


