- Home
- Microsoft 365
- Excel
- Excel does not recognize all indicators
Excel does not recognize all indicators
- Subscribe to RSS Feed
- Mark Discussion as New
- Mark Discussion as Read
- Pin this Discussion for Current User
- Bookmark
- Subscribe
- Printer Friendly Page
- Mark as New
- Bookmark
- Subscribe
- Mute
- Subscribe to RSS Feed
- Permalink
- Report Inappropriate Content
Mar 21 2022 03:44 PM
Hi,
I downloaded some trade statistics about exports/imports of countries for different years. It looks like this :
So here I have indicators (or variables) in the two top rows, yet when formatting it to a table or creating a pivot chart Excel does not recognize the "years" indicator (three values : 2018, 2019, 2020).
Is there a way to transform the years into a kind of filter or variable ?
Thanks !
- Labels:
-
Excel
- Mark as New
- Bookmark
- Subscribe
- Mute
- Subscribe to RSS Feed
- Permalink
- Report Inappropriate Content
Mar 21 2022 09:48 PM
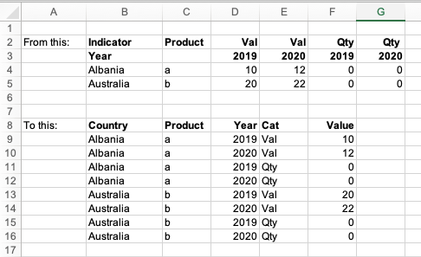
Solution@MaxSchneider You will have to restructure (flatten, also called unpivot) the data in order to be able to create sensible pivot tables from it. The picture below contains an example of what I mean.
If you data set isn't all that big, you could achieve that with several copy/paste actions. But if the data set is bigger and you need to do this on a regular basis, I'd suggest you look into Power Query. Set-up the process correctly once and you can use it over-and-over again.
- Mark as New
- Bookmark
- Subscribe
- Mute
- Subscribe to RSS Feed
- Permalink
- Report Inappropriate Content
Mar 22 2022 02:20 AM
Accepted Solutions
- Mark as New
- Bookmark
- Subscribe
- Mute
- Subscribe to RSS Feed
- Permalink
- Report Inappropriate Content
Mar 21 2022 09:48 PM
Solution@MaxSchneider You will have to restructure (flatten, also called unpivot) the data in order to be able to create sensible pivot tables from it. The picture below contains an example of what I mean.
If you data set isn't all that big, you could achieve that with several copy/paste actions. But if the data set is bigger and you need to do this on a regular basis, I'd suggest you look into Power Query. Set-up the process correctly once and you can use it over-and-over again.

