- Home
- Microsoft 365
- Excel
- Re: EXCEL DO NOT SHOW GRAPH MAP CHART
EXCEL DO NOT SHOW GRAPH MAP CHART
- Subscribe to RSS Feed
- Mark Discussion as New
- Mark Discussion as Read
- Pin this Discussion for Current User
- Bookmark
- Subscribe
- Printer Friendly Page
- Mark as New
- Bookmark
- Subscribe
- Mute
- Subscribe to RSS Feed
- Permalink
- Report Inappropriate Content
Jan 08 2017 06:56 PM
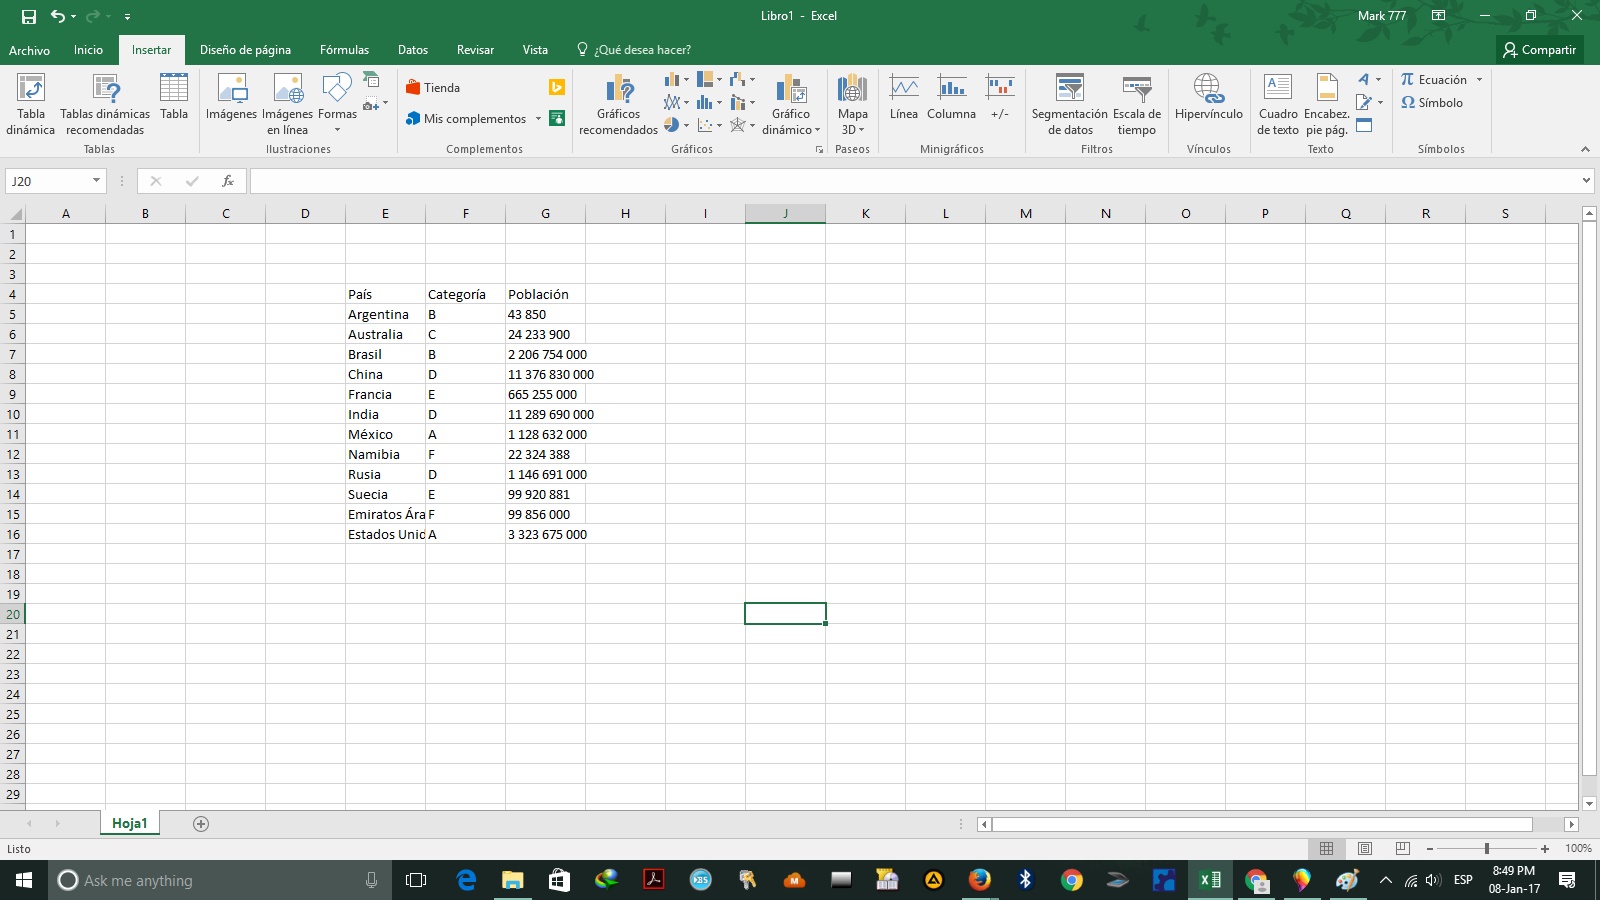
MY EXCEL 2016 DO NOT SHOW ME MAP GRAPH SOMEONE KNOW WHAT IS THE POSSIBLE REASON FOR MY PROBLEM???
- Labels:
-
Excel
- Mark as New
- Bookmark
- Subscribe
- Mute
- Subscribe to RSS Feed
- Permalink
- Report Inappropriate Content
Aug 15 2017 03:34 AM
Dear Sergei,
Can map charts on excel 2016 show multiple legends
- Mark as New
- Bookmark
- Subscribe
- Mute
- Subscribe to RSS Feed
- Permalink
- Report Inappropriate Content
Aug 15 2017 08:14 AM
Hi,
Not sure i catch you - Maps chart could be with value (gradient) legend or category legend. https://support.office.com/en-US/article/create-a-map-chart-f2cfed55-d622-42cd-8ec9-ec8a358b593b. Category legend shows colors for multiple categories.
- Mark as New
- Bookmark
- Subscribe
- Mute
- Subscribe to RSS Feed
- Permalink
- Report Inappropriate Content
Aug 21 2017 03:38 AM
At this moment I have Excel 2016 - 16.0.4549.1000 (MS Office Professional Plus 2016) and still the option is not yet available ....
- Mark as New
- Bookmark
- Subscribe
- Mute
- Subscribe to RSS Feed
- Permalink
- Report Inappropriate Content
Aug 21 2017 03:53 AM
- Mark as New
- Bookmark
- Subscribe
- Mute
- Subscribe to RSS Feed
- Permalink
- Report Inappropriate Content
Dec 11 2017 06:36 AM
Hi Sergei
Hope you can help me as well...
I don't even have the map option....
and I have above version... Do you have any idea why it doesn't work?
Thanks
- Mark as New
- Bookmark
- Subscribe
- Mute
- Subscribe to RSS Feed
- Permalink
- Report Inappropriate Content
Dec 12 2017 10:03 AM
Hi Michael,
Unfortunately i see no pictures within your post, better to attach them
- Mark as New
- Bookmark
- Subscribe
- Mute
- Subscribe to RSS Feed
- Permalink
- Report Inappropriate Content
May 03 2018 05:29 AM
Sergei, I followed your instructions on making sure my maps are visible in Excel 2016 (just upgraded). However, I was denied adding Maps to Main Tabs. Said it needed to be a customized ribbon. Help!
- Mark as New
- Bookmark
- Subscribe
- Mute
- Subscribe to RSS Feed
- Permalink
- Report Inappropriate Content
May 03 2018 05:46 AM
Hi Jeff,
Are you Office 365 subscriber? Map Chart is available only for them.
- Mark as New
- Bookmark
- Subscribe
- Mute
- Subscribe to RSS Feed
- Permalink
- Report Inappropriate Content
May 30 2019 11:08 PM - edited May 30 2019 11:09 PM
I am also unable to see the newer chart options (including Map Chart etc) since Excel upgraded.
I am on Microsoft Excel for Mac version 16.24 with an office 365 subscription
The charts are not showing on the ribbon.
any ideas?
(I also can't seem to post a new thread to the forum - is that because I have only just joined?)
- Mark as New
- Bookmark
- Subscribe
- Mute
- Subscribe to RSS Feed
- Permalink
- Report Inappropriate Content
May 31 2019 01:14 AM
@db402 , can say nothing about Mac version. To start new thread go to https://techcommunity.microsoft.com/t5/Excel/bd-p/ExcelGeneral and Start new conversation. It's available for all registered users.
- « Previous
- Next »