- Subscribe to RSS Feed
- Mark Discussion as New
- Mark Discussion as Read
- Pin this Discussion for Current User
- Bookmark
- Subscribe
- Printer Friendly Page
- Mark as New
- Bookmark
- Subscribe
- Mute
- Subscribe to RSS Feed
- Permalink
- Report Inappropriate Content
Jul 04 2022 03:44 AM - edited Jul 05 2022 11:59 AM
Please I thing to make a chart for machines for visualizing daily running or stoppages time to be dynamic for 24 hours ,one machine per row, just machines number rows and 24 hours steps .as examples below .consider same machine could stop 2 or 3 times through daily . need illustrate stops of same machine horizontally in same row with different time . is that possible in excel and how shortly .


- Labels:
-
Excel
- Mark as New
- Bookmark
- Subscribe
- Mute
- Subscribe to RSS Feed
- Permalink
- Report Inappropriate Content
Jul 04 2022 06:28 AM
I can quite confidently state "Yes, it's possible."
But you need to be a lot more specific on what the inputs would be--what data will you be entering--and what the desired outputs are. You say you want "to visualize daily running or stoppages" but don't give much in the way of details as to what that might look like.
So a helpful way to start building this would be to show us how you're tracking this now.
- Mark as New
- Bookmark
- Subscribe
- Mute
- Subscribe to RSS Feed
- Permalink
- Report Inappropriate Content
Jul 04 2022 02:35 PM
Thank For reply ,i have 10 machines in factory ,i have data per shift ( 3 shifts x 8 hours daily) for every machine like when machine in breakdown for specific issue (from 11:00 pm to 1:00 am as example) and what done to fix the problem and who worked in that time . machine normally stopped per day 2 or 3 times in average 10 to 120 minutes for every time daily .
i need just visualize stoppages in horizontal steps for during 24 hours
and in vertical line machine number or machine name .
- Mark as New
- Bookmark
- Subscribe
- Mute
- Subscribe to RSS Feed
- Permalink
- Report Inappropriate Content
Jul 04 2022 02:43 PM
- Mark as New
- Bookmark
- Subscribe
- Mute
- Subscribe to RSS Feed
- Permalink
- Report Inappropriate Content
Jul 04 2022 02:51 PM
- Mark as New
- Bookmark
- Subscribe
- Mute
- Subscribe to RSS Feed
- Permalink
- Report Inappropriate Content
- Mark as New
- Bookmark
- Subscribe
- Mute
- Subscribe to RSS Feed
- Permalink
- Report Inappropriate Content
Jul 08 2022 11:00 AM
I'm on vacation this week, and so don't really have time to devote to your task. Perhaps somebody else could.
What you've shown us, though, makes me wonder why your very first image (of what I assume is the "raw data") isn't sufficient in itself, especially if sorted in order by machine. All of the information would then be there, and color coding (conditional formatting, automatic) could be used, to indicated whether running or shut down. One thing you'd need to add is some descriptive code; you appear to be using color right now, but don't indicate how that is applied.
So let me ask those two questions very specifically:
- How do you code or mark the status of the machine? Are there subsets--especially for when it's not running (to indicate different reasons, perhaps, such as mechanical difficulties vs manpower shortages, etc)?
- If that table could be sorted in order by machine (and time slots) would that be sufficient to meet your needs? If not, why not?
- Mark as New
- Bookmark
- Subscribe
- Mute
- Subscribe to RSS Feed
- Permalink
- Report Inappropriate Content
Jul 09 2022 04:43 AM
First of All, thanks for your support and enjoy your vacation.
please find my below respond your question.
How do you code or mark the status of the machine? Are there subsets--especially for when it's not running (to indicate different reasons, perhaps, such as mechanical difficulties vs manpower shortages, etc)? running time white, mechanical breakdown green, electrical breakdown yellow, not planned time to run blue.
If that table could be sorted in order by machine (and time slots) would that be sufficient to meet your needs? If not, why not? This table and chart are okay in my photos but only I faced one problem couldn’t solve that If same machine stop for breakdown for second or third time come in chart in different bar below first one but I need to illustrate only one horizontal bar per machine showing different times of breakdowns happened on 24 hours.
Thanks ,
- Mark as New
- Bookmark
- Subscribe
- Mute
- Subscribe to RSS Feed
- Permalink
- Report Inappropriate Content
Jul 11 2022 11:30 AM - edited Jul 11 2022 11:31 AM
Since you do have Excel versions of current files (that formed the basis for the images in your first post),would you be so kind as to post the originals (or copies) either on this forum, or on OneDrive or Google Drive. If you use OneDrive or Google, then be sure to post a link to the file.
That way we won't have to go to the trouble of creating them from scratch; it's always easier to work with the requestor's original.
- Mark as New
- Bookmark
- Subscribe
- Mute
- Subscribe to RSS Feed
- Permalink
- Report Inappropriate Content
Jul 12 2022 10:30 AM
I sent you file attached with message .
Best Regards
Ahmed
- Mark as New
- Bookmark
- Subscribe
- Mute
- Subscribe to RSS Feed
- Permalink
- Report Inappropriate Content
- Mark as New
- Bookmark
- Subscribe
- Mute
- Subscribe to RSS Feed
- Permalink
- Report Inappropriate Content
Jul 12 2022 01:21 PM
I was expecting this file, the one you show in your opening image.

This contains a lot more data to work with than the one you sent. Please attach the original for this one. And please do it here, not in a personal message to me.
- Mark as New
- Bookmark
- Subscribe
- Mute
- Subscribe to RSS Feed
- Permalink
- Report Inappropriate Content
Jul 12 2022 02:57 PM
I attach here original file but i did not try to apply time chart on it .
As i tried o make a charts in that simple sheet shared with earlier message first .
Best Regards
Ahmed
- Mark as New
- Bookmark
- Subscribe
- Mute
- Subscribe to RSS Feed
- Permalink
- Report Inappropriate Content
Jul 13 2022 07:04 AM
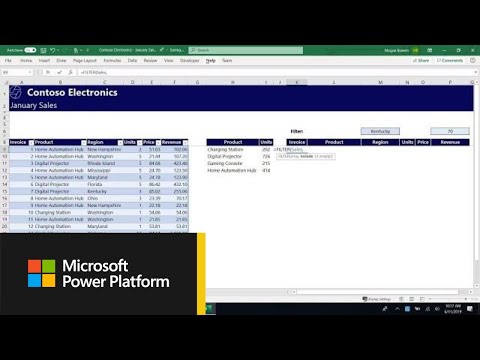
And what I had in mind with my questions was something more simply accomplished by conditional formatting--which you clearly know how to employ, as you have a very sophisticated instance of it in your sheet--and sorting, followed by filtering to highlight any chosen machine. You could focus, for example, on line 23 as shown here. This shows what your bar graphs would show, but is also connected with all of the back up information that you'd immediately want to know as well. You don't have data here on running time, only blockages....

If you have the most recent version of Excel, you could do this using the FILTER function, which can combine Sorting and Filtering in a function, rather than tool bar commands. Here's a YouTube video that explains it.
https://www.youtube.com/watch?v=9I9DtFOVPIg
- Mark as New
- Bookmark
- Subscribe
- Mute
- Subscribe to RSS Feed
- Permalink
- Report Inappropriate Content
Jul 14 2022 03:40 AM
Thanks again for your help, have a nice day.
Best Regards
Ahmed
- Mark as New
- Bookmark
- Subscribe
- Mute
- Subscribe to RSS Feed
- Permalink
- Report Inappropriate Content
Jul 14 2022 08:00 AM
in fact i was dreaming to illustrate breakdowns or blockages by a bar chart during 24 hours rather than Array of table
I know that's what you were dreaming of. My question to you is what THAT--if accomplished--would enable, other than being a fancy bar chart with the built-in satisfaction of having achieved it? What, in other words, is the deeper purpose that could be served by that set of bar charts?
I was simply trying to point to the possibility of achieving that deeper purpose more simply by displaying the raw data itself. And the FILTER function, combined with the SORT function and some judicious use of conditional formatting, could be used toward that end, maybe more robustly. So that remains my question to you. It's why I pointed you to the YouTube video on those functions. I'd like to hear that you've looked at it and at least seen some potential there.