- Subscribe to RSS Feed
- Mark Discussion as New
- Mark Discussion as Read
- Pin this Discussion for Current User
- Bookmark
- Subscribe
- Printer Friendly Page
- Mark as New
- Bookmark
- Subscribe
- Mute
- Subscribe to RSS Feed
- Permalink
- Report Inappropriate Content
Nov 24 2021 03:27 AM - edited Nov 24 2021 09:17 AM
Hi
I'm trying to create some Pivot tables which will then link to a interactive Dashboard. The problem I have is that my data set has heading and subheadings for the columns. The heading has been merged to cover all columns which come under it that being the subheadings, these are ROW 3 and 4 ( row 2 just being used for data retrieval).
I want to know that in this current format can I create Pivot table to use in a dashboard, given the format of headings etc.
First of I'm trying to create a pivot table with Forecast Vs Actuals as a bar graph and slicer for Month-YY.
I have attached my workbook with the data set in Master tab.
- Mark as New
- Bookmark
- Subscribe
- Mute
- Subscribe to RSS Feed
- Permalink
- Report Inappropriate Content
Nov 24 2021 04:57 AM
@excel_learner Couldn't really work with your file on my system. It was very slow with all the formulae and just hung up itself when I tried to add something to it. Therefore, I copied only the Data sheet to a new workbook, as values.
As you already suspected, merged cells are a challenge. Or better to say, they are a pain and should be avoided at all cost during data collection. But fortunately, PQ can fix it. If you want to make a pivot table/chart from your data, you need to unpivot the table first. But you need to merge the two header rows into one.
Merging the two first rows in the data range is done by transposing the table so that the first to rows become the first two columns which you can then merge and transpose back. But since your table is quite large, I split-up the process in two steps. See if you can follow what I did.
The attached file has the PQ output loaded to a Pivot Chart that looks like what you asked for, although I have now idea if the chart makes any sense. That's for you to judge, but I hope you can integrate this technique into your real life workbook.
- Mark as New
- Bookmark
- Subscribe
- Mute
- Subscribe to RSS Feed
- Permalink
- Report Inappropriate Content
Nov 24 2021 06:15 AM
@Riny_van_Eekelen This looks good with the attribute column, Making the charting more versatile.
If I was to update this Dashboard with new data added into CMO input Tab and Forecast Input tab, will this automatically update the Pivot, as the master data is going in Power Query?
- Mark as New
- Bookmark
- Subscribe
- Mute
- Subscribe to RSS Feed
- Permalink
- Report Inappropriate Content
Nov 24 2021 06:41 AM
@excel_learner Can't really predict how this will work in the dashboard you are building, as I haven't been able to look at it.
- Mark as New
- Bookmark
- Subscribe
- Mute
- Subscribe to RSS Feed
- Permalink
- Report Inappropriate Content
Nov 24 2021 07:53 AM
How would I just add the top row as another column so each heading is attributed to the subheadings.
it happens once you transpose table, but then the week no have separate columns which I don't want.
Is there a way I can just get the week no back to rows ?
- Mark as New
- Bookmark
- Subscribe
- Mute
- Subscribe to RSS Feed
- Permalink
- Report Inappropriate Content
Nov 24 2021 11:27 PM
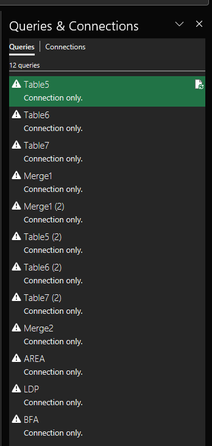
@excel_learner Looked at the original file again, but can't tell how an update would work. The file contains 12 queries, all of which seem to have issues. So, I can't check any of them to see how they will be affected.
Then, I don't really understand your last question about "weeks not having separate columns".
