- Home
- Microsoft 365
- Excel
- Re: Creating a pair of dynamic graphs for a dashboard presentation
Creating a pair of dynamic graphs for a dashboard presentation
- Subscribe to RSS Feed
- Mark Discussion as New
- Mark Discussion as Read
- Pin this Discussion for Current User
- Bookmark
- Subscribe
- Printer Friendly Page
- Mark as New
- Bookmark
- Subscribe
- Mute
- Subscribe to RSS Feed
- Permalink
- Report Inappropriate Content
Jan 18 2022 11:08 AM - edited Jan 18 2022 11:23 AM
I need to create a pair of donut graphs that detect what week the current day/date falls under. Simply put, we are tracking how many lots/work orders pass final inspection and how many get rejected. This needs to be in a rather simple dashboard style presentation for our Monday Manager's Meeting (MMM) every week.
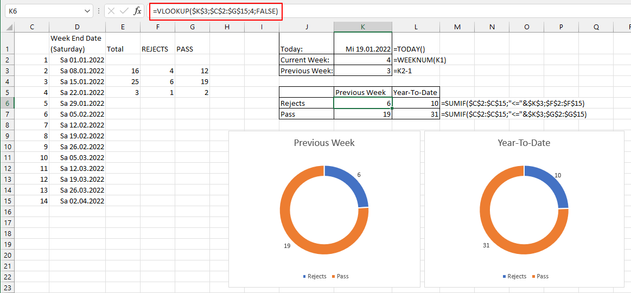
I thought I was going to be able to attach my file but I don't see a button to do that. I'll insert a picture. I want the "PREVIOUS WEEK" graph on the left to detect the current date when they open the file at the MMM, and automatically plot/display the pass/reject info for the previous week. I want the "YEAR-TO-DATE" graph on the right to simply display that: the year-to-date. Obviously, we're not very far into 2022 just yet, but there should be enough there to see what I'm getting at. The formulas/data reference other worksheets, but this is simply a graph question, which is restricted to the sheet in the picture.
- Mark as New
- Bookmark
- Subscribe
- Mute
- Subscribe to RSS Feed
- Permalink
- Report Inappropriate Content
Jan 19 2022 12:11 AM
SolutionHi @Lorenski
you can achieve this with a few simple formulas:
- identify previous week of todays date: =WEEKNUM()
- pick the values for previous week: =VLOOKUP()
- calcualte YTD values: =SUMIF()
In the attached file, you can find my example.
- Mark as New
- Bookmark
- Subscribe
- Mute
- Subscribe to RSS Feed
- Permalink
- Report Inappropriate Content
Jan 19 2022 04:24 PM
Accepted Solutions
- Mark as New
- Bookmark
- Subscribe
- Mute
- Subscribe to RSS Feed
- Permalink
- Report Inappropriate Content
Jan 19 2022 12:11 AM
SolutionHi @Lorenski
you can achieve this with a few simple formulas:
- identify previous week of todays date: =WEEKNUM()
- pick the values for previous week: =VLOOKUP()
- calcualte YTD values: =SUMIF()
In the attached file, you can find my example.

