Turn on suggestions
Auto-suggest helps you quickly narrow down your search results by suggesting possible matches as you type.
Discussion Options
- Subscribe to RSS Feed
- Mark Discussion as New
- Mark Discussion as Read
- Pin this Discussion for Current User
- Bookmark
- Subscribe
- Printer Friendly Page
- Mark as New
- Bookmark
- Subscribe
- Mute
- Subscribe to RSS Feed
- Permalink
- Report Inappropriate Content
Nov 18 2020 06:52 AM
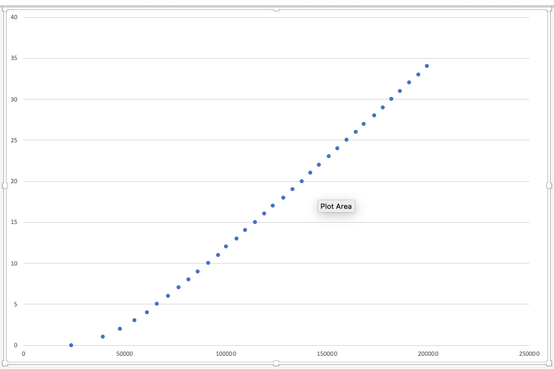
I have made a simple chart with X & Y-axis values. I need help with setting the custom values in Y-axis (Chart 1) as per the attached (Sheet 1)
Labels:
- Labels:
-
Excel
1 Reply
- Mark as New
- Bookmark
- Subscribe
- Mute
- Subscribe to RSS Feed
- Permalink
- Report Inappropriate Content
Nov 18 2020 07:52 AM
@Usman_Shahid Not sure I fully understand but if you change the chart type X-Y you'll get this:
Isn't that what you want?
