Turn on suggestions
Auto-suggest helps you quickly narrow down your search results by suggesting possible matches as you type.
- Home
- Microsoft 365
- Excel
- Re: Can I use a range and a custom list at the same time when I am defining X o Y values of a Chart
Can I use a range and a custom list at the same time when I am defining X o Y values of a Chart ?
Discussion Options
- Subscribe to RSS Feed
- Mark Discussion as New
- Mark Discussion as Read
- Pin this Discussion for Current User
- Bookmark
- Subscribe
- Printer Friendly Page
- Mark as New
- Bookmark
- Subscribe
- Mute
- Subscribe to RSS Feed
- Permalink
- Report Inappropriate Content
Feb 03 2021 09:36 AM
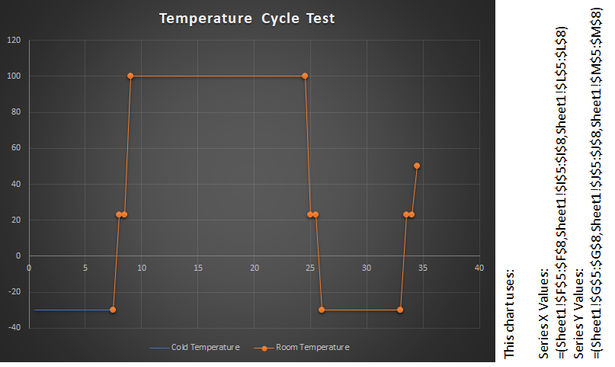
I want to obtain the next result (orange series):
I can do it using the next table:
| Hours | Room Temperature |
| 7.5 | -30 |
| 8 | 23 |
| 8.5 | 23 |
| 9 | 100 |
| 24.5 | 100 |
| 25 | 23 |
| 25.5 | 23 |
| 26 | -30 |
| 33 | -30 |
| 33.5 | 23 |
| 34 | 23 |
| 34.5 | 50 |
But my doubt is:
¿Can I obtain the same result using the ranges + a custom blank list/point in 'Series X values' and 'Series Y values'?
Example of this problem:
Tables
| F | G | H | I | J | K | L | M | |
| 4 | Hours | Room Temperature | Hours | Room Temperature | Hours | Room Temperature | ||
| 5 | 7.5 | -30 | 24.5 | 100 | 33 | -30 | ||
| 6 | 8 | 23 | 25 | 23 | 33.5 | 23 | ||
| 7 | 8.5 | 23 | 25.5 | 23 | 34 | 23 | ||
| 8 | 9 | 100 | 26 | -30 | 34.5 | 50 |
Error obtained when I try to add a custom blank point
Series X Values:
=(Sheet1!$F$5:$F$8,{},Sheet1!$I$5:$I$8,{},Sheet1!$L$5:$L$8)
Series Y Values:
=(Sheet1!$G$5:$G$8,{},Sheet1!$J$5:$J$8,{},Sheet1!$M$5:$M$8)
Labels:
- Labels:
-
Charting
1 Reply
- Mark as New
- Bookmark
- Subscribe
- Mute
- Subscribe to RSS Feed
- Permalink
- Report Inappropriate Content
Feb 03 2021 11:48 PM
@borismario Perhaps not the prettiest solution, but the chart in the attached file looks like the one in your first picture.


