Azure Monitor - Alert Notification via Teams
Published Jul 05 2021 12:00 AM 73.3K Views
Microsoft


Hi there, Bruno Gabrielli here again to talk about how to get alert notification using a Teams channel.


I apologize because this is going to be a long post with all the steps to achieve the notification goals, so please bear with me if you’re interested in getting the configuration done.


Lots of customers are using Teams channel as notification mechanism in their alert management process. They find it very helpful because Teams can be used over mobile devices and browsers without relying on your company laptop. Apparently, there’s no built-in activity in Azure Monitor out of the box to notify an alert via Teams, but we DO have all the pieces that we need.


In this post I will drive you through the Azure Monitor configuration which is behind the Teams channel alert notification mechanism.


First and foremost, a Teams and a Teams channel need to exist. We will not cover this part since it is out of scope, however, should you need information on how to accomplish the pre-requisites you can rely on the following articles:

With that said, here we are with some steps that will be completed in the Azure portal. Let’s see them in detail.


Step 1: Create a blank Logic App

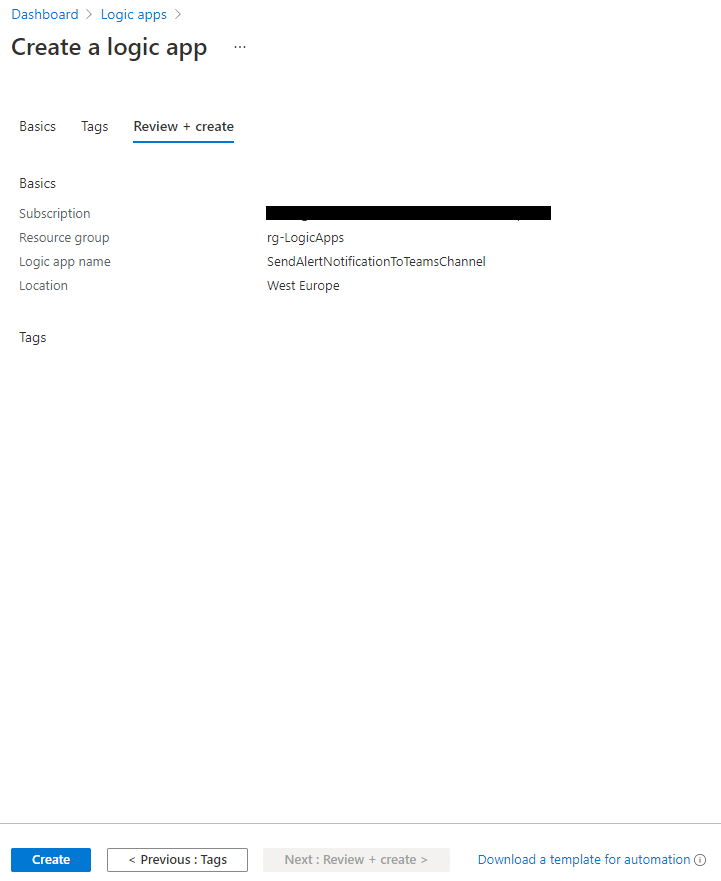
For this step, you need to login to the Azure portal and create a new Logic App. For the purpose of this article, I decided to name it SendAlertNotificationToTeamsChannel, but you can choose the name you prefer the most and according to the company standard you have in place.

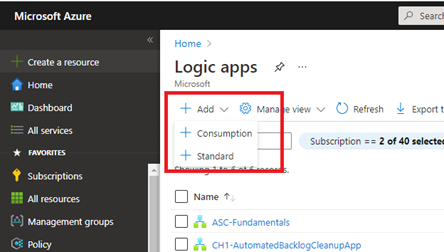
  1. Once you’re in the right place, click on the Add menu and select the Logic App type you want to create. The available types are: Standard and Consumption. You can find all the necessary info in the page Pricing and billing models for Azure Logic Apps at https://docs.microsoft.com/en-us/azure/logic-apps/logic-apps-pricing


BrunoGabrielli_4-1625142619856.png


  1. Once you have selected the billing model that best suite your needs, you will be presented with a page in which you will select/enter basic initial information, such as:
  • Subscription
  • Resource Group
  • Logic App name
  • Region

1.png


  1. As you can see from the above screenshot, you can also choose to associate the Logic App with an ISE and or to enable Log Analytics for observability purpose (which is always recommended). Specify the Tags if used and then click on the Review + create button. Once the validation process has finished click on the Create button.


2.png


  1. The deployment of a new Logic App will start. Once completed click on the Go to resource button to get redirected on the newly created Logic App designer page for editing.


3.png


Step 2: Configure the Logic App

  1. In the Logic App designer page, click on When a HTTP request is received. This will be our trigger.


BrunoGabrielli_8-1625146576181.png


  1. After the selection, you will be presented with the Logic App designer canvas. This is where we will do all our remaining configurations starting with the trigger activity we just added.


BrunoGabrielli_9-1625146576205.png


  1. Configure the activity with the JSON schema that the trigger will use. Since the request will contain the alert’s JSON payload, you can refer (and use) the sample schema you can find in the article Common alert schema definitions at https://docs.microsoft.com/en-us/azure/azure-monitor/alerts/alerts-common-schema-definitions .Copy the sample alert payload from the page, click on Use sample playload to generate schema, paste the content and click Done


BrunoGabrielli_10-1625146576225.png


  1. Now let’s have some fun with the notification formatting. Since I preferred to create different activities to notify specific information according to the type of alert (i.e., Metrics, Log Analytics or Application Insight alerts), I created 3 separate but similar activities which differ only in some parts that are related in the information to be sent. If you prefer having just one notification activity for all alert type, jump to step 7
  2. To create a condition used to decide which notification activity to use, click on the New Step, in the search box type Control


BrunoGabrielli_19-1625147748170.png


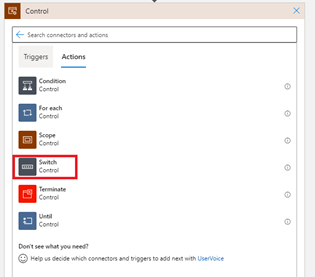
  1. Select the Control group and then select the Switch activity to add it to the canvas. For groups with lots of activities, you can enter the activity name or part of it in the search box.


BrunoGabrielli_20-1625147765940.png


  1. To configure this activity:
    1. Click on the On field and select monitoringService from the Dynamic content list


      BrunoGabrielli_22-1625148131758.png


    2. Click on the Equals and enter the string corresponding to the alert type you’re going to create the notification for. For the possible values to be used you can refer at the samples in the Common alert schema definitions at https://docs.microsoft.com/en-us/azure/azure-monitor/alerts/alerts-common-schema-definitions located under the Alert context paragraph. In this example we will use the Metric alerts (excluding availability tests) section, hence as value we will enter Platform.


      BrunoGabrielli_23-1625148277434.png


    3. If you like to configure specific notification activities, click on the +sign between the 2 blocks and add a new case and configure it accordingly (for configuration step, refer to step b above) or add the notification activity as a new action inside the specific case (see next steps)
  1. Now we can move on with the notification activity. As we did for the Switch action, click on New step (or click on Add an action if you’re adding it as a child action as result of choice made during step 4)
  2. Follow what has been described in steps 5 and 6 using Microsoft Teams as group and Post a message (V3) (Preview) as action
  3. Once added, this activity needs some configuration:
    • Team ID
    • Channel
    •  Message
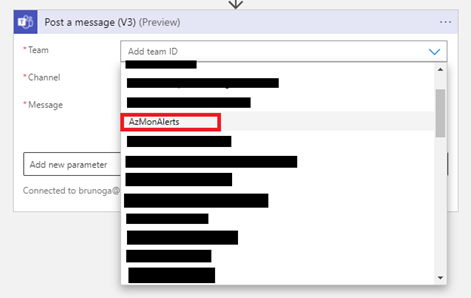
      1. As far as the Team ID and the Channel go, you can select them from a drop-down list


        BrunoGabrielli_15-1625146576272.png


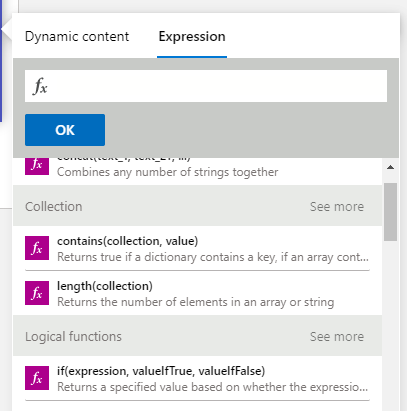
      2. With regards to the Message body part, this is representing the information sent through the notification. Here you can enter static text formatted as you like, dynamic content as well as formulas. In my example I started with a kind of title and followed with sections under which there are the info I wanted to send. For the static text, you just need to write it. For the dynamic content and/or formulas, once you decided the line where to put it, click on Add dynamic content and select it from the side panel click in the Message canvas and either select it from the Dynamic content list or assemble it using the Expression builder


        BrunoGabrielli_16-1625146576280.png


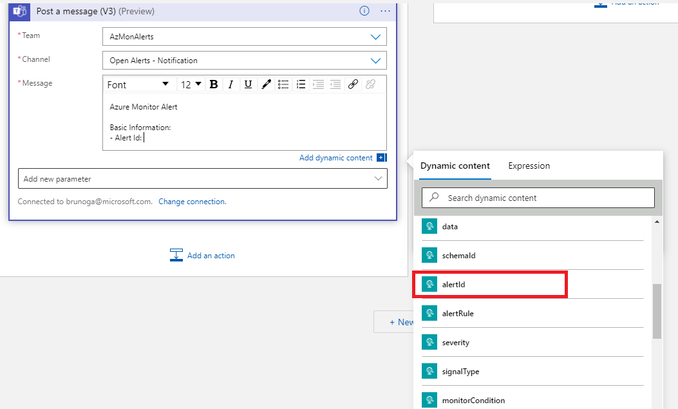
        In this post, since I got everything correctly parsed from the trigger activity (the When a HTTP request is received), I will go use the dynamic content only. For instance, after heving put some text like – Alert Id: I will select alertId content from the list


        BrunoGabrielli_17-1625146576299.png


      3. Repeat the above step for all the field you want to make part of the message such as Alert Rule Name, Severity, Description, etc.
  1. Once the activity configuration is complete, repeat the steps 8, 9 and 10 if you want to add more specific notification activity or click on Save when done.


BrunoGabrielli_18-1625146576317.png


Step 3: Configure the Action Group

Now that the Logic App has been created, we need to configure an Action Group to use it in order receive our alerts as expected.

From the Azure Monitor blade, follow the steps below:

  1. From the Alerts page, click on Manage actions


11.png


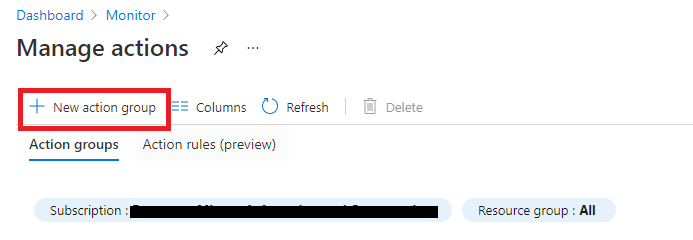
  1. Click on New action group


4.png


  1. Enter the necessary basic information and click on Next: Notifications >
    1. Subscription
    2. Resource group
    3. Action group name
    4. Display name


5.png


  1. Leave everything unchanged click on Next: Actions >
  2. Configure the following according to what has been created before:
    1. Action type
    2. Name
    3. Selected

, making sure to enable the common alert schema and select


6.png


  1. Click on Next: Tags >and configure the Tags if necessary. Then click on Next: Review + create >and the on Create

Step 4: Add the new action group to your alerts

Now that we have the Action group created and configured, we need to add it to all the alerts we want to notify:

  1. From the Alerts page, click on Manage alert rules


7.png


  1. Identify the alert you want to notify (i.e., the Low CPU usage on Virtual Machines) and click on it to edit


8.png


  1. In the Actions section, add the new action group to the existing one (or remove them if not necessary anymore) by clicking on the Manage action groups


BrunoGabrielli_30-1625148464846.png


  1. Select the newly created (and de-select the selected ones if necessary) and click Select


9.png


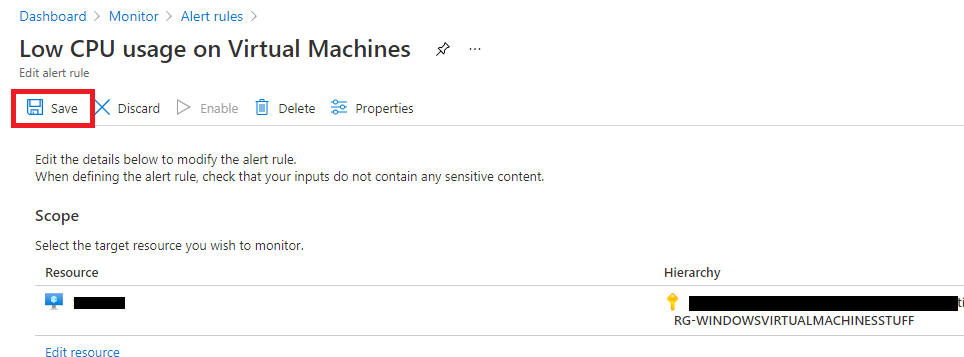
  1. Click Save to save and apply the changes


10.png


Step 5: Test, test, test

As always when re-using something from others, we gotta make sure it works in our environment. What’s better than a deep test session? Play with the alert rules you configured to generate some alert and see if it gets notified. If everything went smoothly, we should get notifications similar to the one below in our Teams:


BrunoGabrielli_33-1625148528212.png


Hope that will make the Alert Management process as well as the Notification process easier and usable enough.


Thanks for reading through the entire loooooong post :xd:


Disclaimer

The sample scripts are not supported under any Microsoft standard support program or service. The sample scripts are provided AS IS without warranty of any kind. Microsoft further disclaims all implied warranties including, without limitation, any implied warranties of merchantability or of fitness for a particular purpose. The entire risk arising out of the use or performance of the sample scripts and documentation remains with you. In no event shall Microsoft, its authors, or anyone else involved in the creation, production, or delivery of the scripts be liable for any damages whatsoever (including, without limitation, damages for loss of business profits, business interruption, loss of business information, or other pecuniary loss) arising out of the use of or inability to use the sample scripts or documentation, even if Microsoft has been advised of the possibility of such damages.

25 Comments
Iron Contributor

Hello Bruno,

thanks a lot for sharing this interesting and useful info with us...


Copper Contributor

May I suggest pagerduty is a simpler solution with a lot more focus. 

Copper Contributor

Screenshots are too small, that makes the post difficult to follow. 
Great content though

Microsoft

@dmbuk : Thanks for the suggestion. I made them bigger. Let me know if it's better/ok now.

Copper Contributor

Thanks Bruno,


How to add a link "View the alert in Azure Monitor" (same as in email notification)?


or another link to acknowledge the alert?

Microsoft

Hello @Ruslan180,

you might need to manage other fields in the sample Logic App. For instance you could use the linkToSearchResultsUI or linkToFilteredSearchResultsUI coming as part of the JSON alert definition to be included in the notification. Common alert schema documentation with field references can be found at https://docs.microsoft.com/en-us/azure/azure-monitor/alerts/alerts-common-schema-definitions.

Copper Contributor

Hi @Bruno Gabrielli yes, I checked that. This is not exactly what I am looking for.


I want an engineer to see the message in Teams click on the link and set status of the alert to "acknowledged". I could not find such link in the schema. 


However, when alert notification is sent via email there is a big blue button "View the alert in Azure Monitor" 


Without ability to acknowledge the alert Teams notifications are kind of meaningless. 

Copper Contributor

Actually I found the way to compose the url

concat('https://portal.azure.com/#blade/Microsoft_Azure_Monitoring/AlertDetailsTemplateBlade/alertId/', replace(triggerBody()?['data']?['essentials']?['alertId'], '/''%2F')) but I could not make it a link 🤦
Microsoft

@Ruslan180 I think I found the issue with your approach. It's about the way you compose the URL with the concat function. The link should be formatted with an href inside an a html tag. I used this syntax and it worked for me:

 
concat('<a href=','"https://portal.azure.com/#blade/Microsoft_Azure_Monitoring/AlertDetailsTemplateBlade/alertId/',replace(body('Parse_JSON')['data']['essentials']['alertId'],'/','%2F'),'">Open in Azure Monitor</a>')


I put it in to a variable, and then used the variable inside the message composition blocks, so every change will be reflected with no issue/differences.


HTH,

Bruno.

Copper Contributor

Hi @Bruno Gabrielli Thank you for sharing such a wonderful and useful post.


I apologize if missing the sample code but unable to find any attachment with this post.


Also, after so many attempts, I couldn't figure out to get Application Insights' alert on teams. The alert which contains "custom log" signal.

I tried to create two cases, one for "Platform" and another for "Application Insights" but it didn't work.


I would appreciate any help.


muhammadzeeshanmcp12_0-1628088673125.png


Microsoft

Hi @muhammadzeeshanmcp12 , the mention of a downloadable file was a leftover from a draft and I just removed it. Thanks to have notified. To get exactly which case to configure you need to check the alert JSON and create the case accordingly or you can refer to the Common alert schema definitions documentation with particular focus on the Log alerts paragraph.


HTH,

Bruno.

Copper Contributor

Hi @Bruno Gabrielli Thank you so much for your help.


It seems the issue is with the Sample alert payload defined here. It's "alert context" has different properties than mentioned in "Application Insights". So, when I upload this alert payload in "Use sample payload to generate schema" it does not contain properties of alert context for "Application Insights". For example:

Alert context properties for "Application Insights"

        "alertContext": {
            "SearchQuery": "requests\n| where resultCode == 302",
            "SearchIntervalStartTimeUtc": "2021-08-04T15:10:40Z",
            "SearchIntervalEndtimeUtc": "2021-08-04T15:15:40Z",
            "ResultCount": 12,
            "LinkToSearchResults": "https://portal.azure.com/AnalyticsBlade/subscriptions/12345a-1234b-123c-123d-12345678e/?query=search+*+&timeInterval.intervalEnd=2018-03-26T09%3a10%3a40.0000000Z&_timeInterval.intervalDuration=3600&q=Usage",
           "LinkToFilteredSearchResultsUI": "https://portal.azure.com/AnalyticsBlade/subscriptions/12345a-1234b-123c-123d-12345678e/?query=search+*+&timeInterval.intervalEnd=2018-03-26T09%3a10%3a40.0000000Z&_timeInterval.intervalDuration=3600&q=Usage",
           "LinkToSearchResultsAPI": "https://api.applicationinsights.io/v1/apps/0MyAppId0/metrics/requests/count",
           "LinkToFilteredSearchResultsAPI": "https://api.applicationinsights.io/v1/apps/0MyAppId0/metrics/requests/count",
            "SearchIntervalDurationMin": "5",
            "AlertType": "Number of results",
            "IncludeSearchResults": true,
            "SearchIntervalInMinutes": "5",
            "Threshold": 10.0,
            "Operator": "Greater Than",
            "ApplicationId": "64c9c958-a3c6-44a1-9505-47ed33f730b0",
            "IncludedSearchResults": "False"
        }


Alert context properties for "Platform":

    "alertContext": {
      "properties": null,
      "conditionType": "SingleResourceMultipleMetricCriteria",
      "condition": {
        "windowSize": "PT5M",
        "allOf": [
          {
            "metricName": "Percentage CPU",
            "metricNamespace": "Microsoft.Compute/virtualMachines",
            "operator": "GreaterThan",
            "threshold": "25",
            "timeAggregation": "Average",
            "dimensions": [
              {
                "name": "ResourceId",
                "value": "3efad9dc-3d50-4eac-9c87-8b3fd6f97e4e"
              }
            ],
            "metricValue": 7.727
          }
        ]
      }
    }


Difference can be find out in "operator" property in both alert contexts.


Teams connector:

muhammadzeeshanmcp12_0-1628150225582.png


Teams alert:

muhammadzeeshanmcp12_1-1628150262485.png

It didn't add the "Operator" details in "Platform" alert because alert context in sample payload was from "Application Insights"


Here, it added the value because monitoring service was "Application Insights".

muhammadzeeshanmcp12_4-1628150615390.png


muhammadzeeshanmcp12_2-1628150348826.png


So, I'm not getting idea if we have any alert schema which works with all type of alerts' "essentials" and "alertContext".


When I upload alert schema defined here it does not get some properties in dynamic content section.

Copper Contributor

Maybe it's just me, but this seems overly complex just to get an alert into a teams, plus the additional cost of running a logic app. Is it not on the roadmap for the appinsights team to offer ms teams integration out-of-the-box?

Copper Contributor

I am having troubles in adding the Logic App to an action group.

When selecting an action in the action group, the Logic App does not appear as a Logic App but as an Azure Function App and in the Azure function parameter the workflow does not appear.

See in this image that the Logic App does not appear as a Logic App, but as an Azure function. However, the workflow "testTC" does not appear in "TCedocDiogo", so I can't select the workflow I created.


However the logic app is correctly configured and in the resource group.
See these images:


Am I doing something wrong or is this a bug of the Logic Apps (2.something out of 5 score)?
The workflow "testTC" of the Logic App "TCedocDiogo" does not appear in the action group drop down menu.
All the resources are deployed on the same location and resource group so this is not the problem as well.
It also says in the dropdown menu that only functions with Http Trigger are displayed, which is the case. My workflow starts with an HttpTrigger.


Copper Contributor

Had the same problem, fixed it by using a "consumption" type logic app, not a "standard" one. Then the logic app appears in the action group.

Copper Contributor

Hi @Bruno Gabrielli , when you say "In this example we will use the Metric alerts (excluding availability tests)", why are Availability Tests excluded?

Trying to figure out if this is because is not possible to get these in Teams or else. Essentially I'm not getting great results with these and can't find any valid examples on how to implement them.

cristianaccess_0-1636589057314.png

Microsoft

Hi @cristian-access , It's just for the example purpose. It is absolutely possible to use the availability tests provided that you use the right payload and you modify the LogicApp accordingly. They just have some small differences and that's the reason why I mentioned the non-use for this specific example. Information reported at Metric alerts - Availability tests should provide the necessary information con properly modify and configure the LogicApp.


Thanks,

Bruno.


Copper Contributor

Thanks for your reply @Bruno Gabrielli.

Essentially I've copied the given example payload (which is for a VM) and replaced the alertContext block with that of the Availability tests so now my payload looks like this:

{
  "schemaId": "azureMonitorCommonAlertSchema",
  "data": {
    "essentials": {
      "alertId": "/subscriptions/<subscription ID>/providers/Microsoft.AlertsManagement/alerts/b9569717-bc32-442f-add5-83a997729330",
      "alertRule": "WCUS-R2-Gen2",
      "severity": "Sev3",
      "signalType": "Metric",
      "monitorCondition": "Resolved",
      "monitoringService": "Platform",
      "alertTargetIDs": [
        "/subscriptions/<subscription ID>/resourcegroups/pipelinealertrg/providers/microsoft.compute/virtualmachines/wcus-r2-gen2"
      ],
      "configurationItems": [
        "wcus-r2-gen2"
      ],
      "originAlertId": "3f2d4487-b0fc-4125-8bd5-7ad17384221e_PipeLineAlertRG_microsoft.insights_metricAlerts_WCUS-R2-Gen2_-117781227",
      "firedDateTime": "2019-03-22T13:58:24.3713213Z",
      "resolvedDateTime": "2019-03-22T14:03:16.2246313Z",
      "description": "",
      "essentialsVersion": "1.0",
      "alertContextVersion": "1.0"
    },
	"alertContext": {
      "properties": null,
      "conditionType": "WebtestLocationAvailabilityCriteria",
      "condition": {
        "windowSize": "PT5M",
        "allOf": [
          {
            "metricName": "Failed Location",
            "metricNamespace": null,
            "operator": "GreaterThan",
            "threshold": "2",
            "timeAggregation": "Sum",
            "dimensions": [],
            "metricValue": 5,
            "webTestName": "myAvailabilityTest-myApplication"
          }
        ],
        "windowStartTime": "2019-03-22T13:40:03.064Z",
        "windowEndTime": "2019-03-22T13:45:03.064Z"
      }
    }
  }
}

I guess at the time of writing this tutorial, there was a "Post a message (V3) (Preview)" Teams task but as I can't find that, I'm using the "Post message in a chat or channel" with (for a test) just a couple of Dynamic Content fields, severity and description:

cristianaccess_0-1636622518395.png

My alert ARM:

{
  "name": "[concat(variables('webAppName'), ' Ping Alert')]",
  "type": "Microsoft.Insights/metricAlerts",
  "apiVersion": "2018-03-01",
  "location": "global",
  "dependsOn": [
    ...
  ],
  "tags": {
    ...
  },
  "properties": {
    "description": "[concat('The ', variables('webAppName'), ' App Service appears to be unavailable')]",
    "severity": 0,
    "enabled": true,
    "scopes": [
      "[resourceId('Microsoft.Insights/webtests', variables('pingTestName'))]",
      "[resourceId('Microsoft.Insights/components', variables('appInsightsName'))]"
    ],
    "evaluationFrequency": "[parameters('monitorEvaluationFrequency')]",
    "windowSize": "[parameters('monitorWindowSize')]",
    "criteria": {
      "odata.type": "Microsoft.Azure.Monitor.WebtestLocationAvailabilityCriteria",
      "webTestId": "[resourceId('Microsoft.Insights/webtests', variables('pingTestName'))]",
      "componentId": "[resourceId('Microsoft.Insights/components', variables('appInsightsName'))]",
      "failedLocationCount": 2
    },
    "actions": [
      {
        "actionGroupId": "[parameters('monitorActionGroups_APaP_Developers_externalId')]"
      }
    ]
  }
}

However, with the above test example I'm not getting any data in the Teams channel:

cristianaccess_1-1636623662528.png

This drives me nuts and also the idea of having to create multiple payloads for different alert types is a little bit discouraging.

Also, when using conditions with that Switch and the monitoringService Platform, well in my case I use all three types of metric alerts (Static threshold, Dynamic threshold and Availability tests) so I wonder how that can be handled.

I know I'm jumping ahead a little, at the moment I can't even get the Availability tests right... :D :(

Copper Contributor

@Bruno Gabrielli - Can you please help me to implement this design ? I have followed the steps given above but it throws an error as give in the screenshot below.

Monica2100_0-1641998215757.png


Microsoft

Hey, I had to login with my personal account to MS Teams in the logic app. Now the notifications are generated with my name. Isn't there any other way to send messages to the Teams channel without my name being shown? 

Microsoft

Hello @dipanshusharma ,
i never tried but since there's the possibility in the Teams activity block to post as Flow bot or Power Virtual Agents (Preview), you can try one of those or create a specific account to be used only to send this notifications.


Hope that helps,

Bruno.

Iron Contributor

Why would two native Microsoft technologies require this Logic App to use webhooks when vendors use Webhooks in to Teams to send alerts with ease?  This is a tremendous amount of effort to do something other vendors make look effortless.


When's this going to be abandoned and natively supported directly within Azure to Team for notifications?

Copper Contributor

@Bruno Gabrielli - Can you please help me to implement this design ? I have followed the steps given above but it throws an error as give in the screenshot below.

Shilpa_Ramkarishnan_0-1693517684195.png


Copper Contributor

Thank you very much for the info. it is very helpful.


One question: how to chance my name in the messages posted in MS teams to a service principle name or managed identity name. I created logic app, action group, alert rules by login Azure using my personal names. however I don't want to show my name in those messages.


Thanks you very much.


Microsoft

Hello @peterxuCan ,

as far as I know, the only way to change the name of the sender is to change the connection to use an account which has been created for that purpose. Unfortunately, it is forbidden to use Azure Monitor relays to send messages. Here's why you need to establish a connection with a mail-enabled user account. If you used yours initially, you need to change the credential in the connection in the logic app.


HTH,

Bruno.

Co-Authors
Version history
Last update:
‎Mar 14 2023 08:54 AM
Updated by: