- Subscribe to RSS Feed
- Mark Discussion as New
- Mark Discussion as Read
- Pin this Discussion for Current User
- Bookmark
- Subscribe
- Printer Friendly Page
- Mark as New
- Bookmark
- Subscribe
- Mute
- Subscribe to RSS Feed
- Permalink
- Report Inappropriate Content
Apr 09 2021 01:47 AM - edited Apr 09 2021 01:48 AM
Hello,
we have moved our Tableau Server to a VM some time ago (1 OS disk, 3 storage disks).
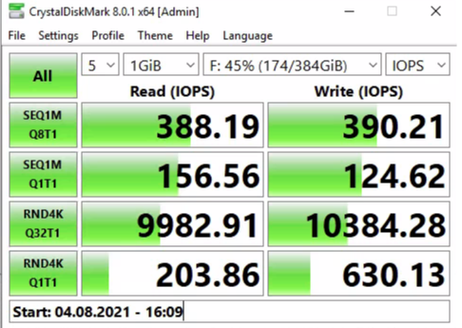
Yesterday I did a test with CrystalDiskMark, the results of one of the storage disks as well as the configuration in the pictures below:
The disks should have max IOPS of 500, but in the test I get different results. How are these to be interpreted? Are there other tools that can better measure disk performance on an Azure VM?
We are sure that we are not interpreting the results correctly or they are incorrect. So I'd also like to learn a bit more about the technical background of how storage disks work on Azure.
Thanks, we look forward to feedback.
- Labels:
-
Azure
-
Data + Storage
-
monitoring

