Turn on suggestions
Auto-suggest helps you quickly narrow down your search results by suggesting possible matches as you type.
- Home
- Azure Data
- Azure Synapse Analytics Blog
- Performance Benchmark - Azure Synapse Analytics (Data Warehouse)
Performance Benchmark - Azure Synapse Analytics (Data Warehouse)
- Subscribe to RSS Feed
- Mark as New
- Mark as Read
- Bookmark
- Subscribe
- Printer Friendly Page
- Report Inappropriate Content
By
Published
May 11 2020 08:18 PM
8,903
Views
May 11 2020
08:18 PM
May 11 2020
08:18 PM
Today, any organization who is ready to spin Azure service always curious of performance, load, design etc. The story is no different with data. With Azure Synapse DWH organization want to make sure they choose right skus and design to benefit customer and themselves. Any organization can come up with following questions
- Are we choosing right sku for current and future workload?
- Are we utilizing the resources well?
- What about the latency?
- Based on upcoming request, what will be the impact on allocated resources aka load testing?
- How to make sure queries are performing well on DWH design?
- How to build baseline matrix?
Well, one of the ways is to monitor (and setup alerts) the service on production environment and adjust the sku. However this may impact the user experience and become hard practice to follow. This blog post try to overcome such problems in advance to avoid any surprises on production environment. The focus will be on building a framework to simulate the load with multiple sql queries and get answer for above questions.
Reference Architecture
In this end to end architecture, we'll simulate the load from different regions with different queries. The outcome will help us understand if we choose right sku and setup good DWH design like table distribution, index, cache etc . Here is the reference architecture of the framework
 Architecture diagram
All scripts and step by step guide can be found here. However, below are the steps to build the framework along with few pictures.
Setting up environment
- Azure Synapse Analytics (Data warehouse)
- Setup Data warehouse
-
Download and configure Apache Jmeter
- Build Java Management Extension (aka jmx) file
- Move scripts to Azure storage
- Execute work load
 JDBC Request Diagram

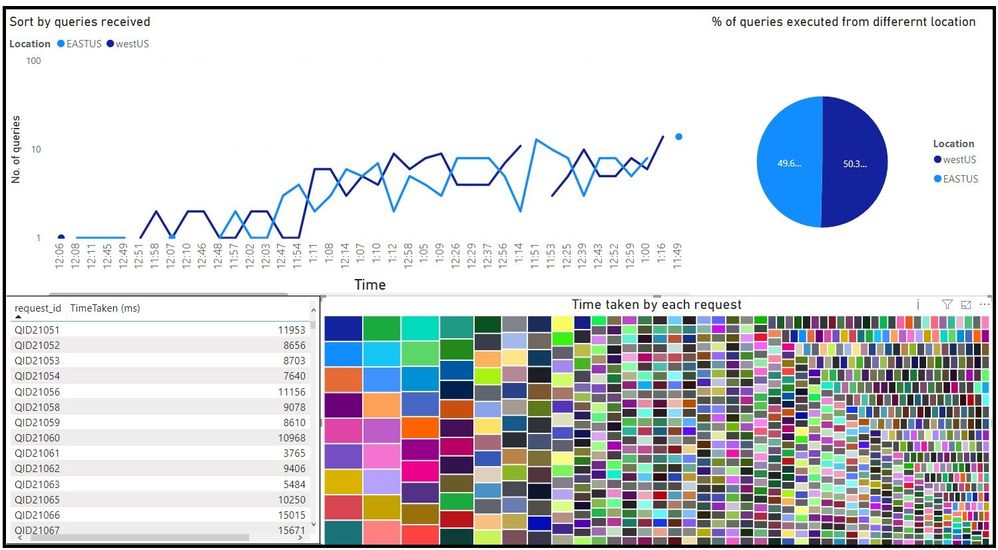
Analyse the Test Results
-
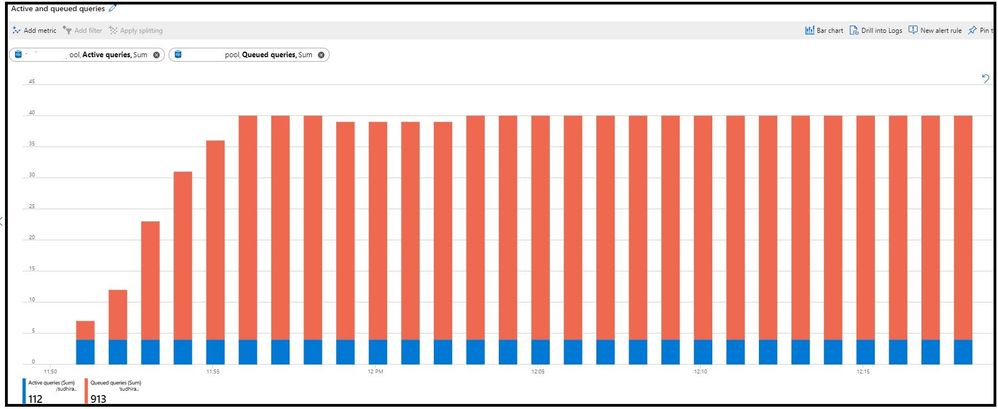
Investigate result over Azure portal dashboard
- Understand the bottleneck and performance
1) Table Distribution2) Partition strategy3) Index4) Cache6) Views -
Apache Jmeter Report


4 Comments
You must be a registered user to add a comment. If you've already registered, sign in. Otherwise, register and sign in.