- Home
- Azure Data
- Azure SQL Blog
- Monitoring Azure SQL Database with Telegraf
- Subscribe to RSS Feed
- Mark as New
- Mark as Read
- Bookmark
- Subscribe
- Printer Friendly Page
- Report Inappropriate Content
In a prior blog, we have described the Real-time monitoring for Azure SQL Database Managed Instance using the Telegraf SQL plugin. In addition to Managed Instance support, Telegraf now also includes support for Azure SQL Database single databases, and can be used to monitor them in near-real time in a similar fashion. This is one of several monitoring solutions for Azure SQL Database, which also include Azure SQL Analytics, and many third party solutions.
In addition, Azure SQL Database also provides Performance insights, Automatic tuning, and Diagnostics logging features to support insights into query performance.
Solution setup
For this solution using Telegraf, detailed setup instructions and setup shell scripts are in Azure SQL DB monitoring GitHub repo. For detailed setup steps, see the readme file in that repo. As an outline, the setup steps are as follows:
- Create an Ubuntu VM. Other Linux distributions can be used as well, but commands have to be adjusted accordingly.
- Clone the repo.
- Run the monitoringsetup.sh script which does the following:
- Installs Docker
- Installs the latest Telegraf release build for Ubuntu. If you prefer a nightly build for the latest changes, pass the parameter “nightly” on command line.
- Pulls the Grafana docker image
- Opens TCP port 3000 in the firewall for accessing Grafana
- Copies the telegraf.conf sample file, and adjusts permissions on that file
- Install, configure and start InfluxDB.
- Create logins/users for each Azure SQL Database being monitored, and grant permissions.
- Edit Telegraf configuration file:
- Add the appropriate connection strings, one per database being monitored.
- Set the azuredb=true flag to monitor Azure SQL database.
- Exclude the collectors you do not need.
- Start Telegraf service.
- Configure Grafana data source, and import Grafana dashboards located here. There are separate dashboards for Managed instance as compared to Azure SQL Database.
The Telegraf configuration file (telegraf.conf) instructs the SQL plugin to run the collectors below by default.
- PerformanceCounters – Performance counters from dm_os_performance_counters
- DatabaseIO - IO Statistics from dm_io_virtual_file_stats
- WaitStatsCategorized – Database level wait statistics from dm_db_wait_stats
- AzureDBResourceStats – Azure SQL Database resource stats from dm_db_resource_stats
- AzureDBResourceGovernance – Resource Governance limits from dm_user_db_resource_governance
- MemoryClerk – Memory consumption from dm_os_memory_clerks
- Schedulers – Scheduler utilization from dm_os_schedulers
- SqlRequests – Requests from dm_exec_requests
Grafana Dashboards
There are three dashboards. You can switch between dashboards while keeping the target database and time interval unchanged, to focus on different performance monitoring areas.
SQL DB Performance
This is the primary dashboard, providing an overview of performance at the SQL Server instance level, and at the database level. Note that in Azure SQL Database, the server is just a logical construct (a logical grouping of databases). This dashboard allows you to choose a logical server, and then drill down into a specific database on that server. The logical server is different from the physical SQL Server instance hosting each database.
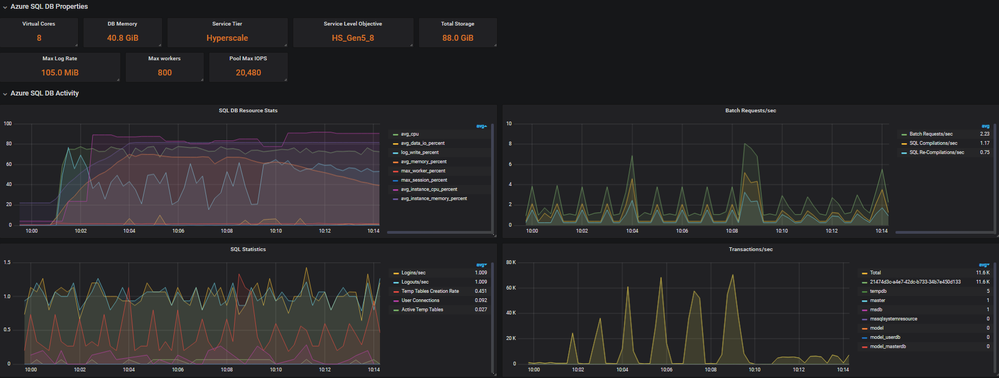
The dashboard is organized into collapsible sections including properties and limits based on the database tier and service level, database activity, database waits, log activity, CPU, workload groups, and memory.
The “Overview” and “Azure SQL DB Activity” depicts and overall picture including resource governance properties, database level restoure stats and a measure of workload throughput in batch requests/sec and transactions/sec.

The “Waits and queues” sections depicts waits on SQL Server and is a primary step in troubleshooting bottlenecks.

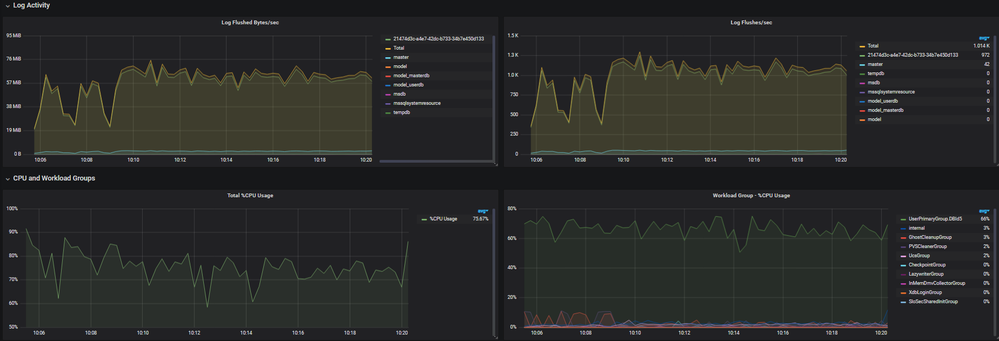
The “Log Activity” section shows the log generation rate an important metric when loading data. The “CPU and workload group” section gives visibility into CPU usage by workload groups. The UserPrimary group is the workload group that all user activity lands in, the other workload groups are internal workload groups mainly for background and system level activities.

SQL DB Storage
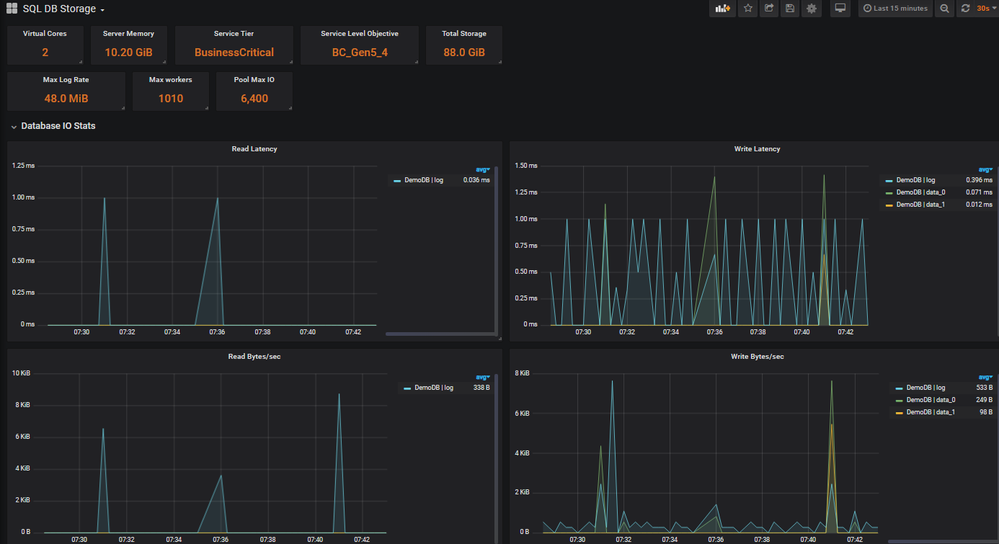
This is the dashboard for monitoring file size and space used, IO latency, and IO throughput, for each file in the database. When using Standard or General Purpose databases, which use data files in Azure blob storage, storage performance depends on several blob properties, exposed via the FILEPROPERTYEX() function.
For example, for the General Purpose tier, you could determine the blob type for your files from the query below and then understand the IO Limits for specific blob tier.
SELECT s.file_id,
        s.type_desc,
        s.name,
        FILEPROPERTYEX(s.name, 'BlobTier') AS BlobTier,
        FILEPROPERTYEX(s.name, 'AccountType') AS AccountType,
        FILEPROPERTYEX(s.name, 'IsInferredTier') AS IsInferredTier,
        FILEPROPERTYEX(s.name, 'IsPageBlob') AS IsPageBlob
       , size *8/(1024*1024*1.0) as size_GB
FROM sys.database_files AS s
WHERE s.type_desc IN ('ROWS', 'LOG');
SQL DB Estate
This dashboard gives you an overview of your Azure SQL Database estate (as referenced in telegraf.conf). There is a single row per logical server, and a view of the databases under it. For each database, you can drill through to the performance dashboard for closer investigation.
Conclusion
The Telegraf based solution described in this article can be deployed quickly to enable in-depth near-real time performance monitoring for your Azure SQL DB databases. The solution uses lightweight DMV queries to collect performance data and present it on easy to use Grafana dashboards. Historical performance data is retained, up to the retention period configured in the InfluxDB database.
The solution is open source, and we will welcome and appreciate contributions from the community. Contributions to the Telegraf collector should be made via pull requests to the SQL Server Input Plugin GotHub repo for Telegraf. For changes to Grafana dashboards, pull requests should be made to the sqldbmonitoring GitHub repo.
The solution we described runs on Linux. However, if using Windows is preferred, Telegraf can be run as a Windows service. You can also install the Windows versions of Grafana and InfluxDB, to have the entire solution working on Windows or run Linux containers on windows.
You must be a registered user to add a comment. If you've already registered, sign in. Otherwise, register and sign in.

