- Home
- Security, Compliance, and Identity
- Microsoft Sentinel Blog
- What’s new: SOC operational metrics now available in Microsoft Sentinel
- Subscribe to RSS Feed
- Mark as New
- Mark as Read
- Bookmark
- Subscribe
- Printer Friendly Page
- Report Inappropriate Content
This instalment is part of a broader series to keep you up to date with the latest features in Microsoft Sentinel. The instalments will be bite-sized to enable you to easily digest the new content.
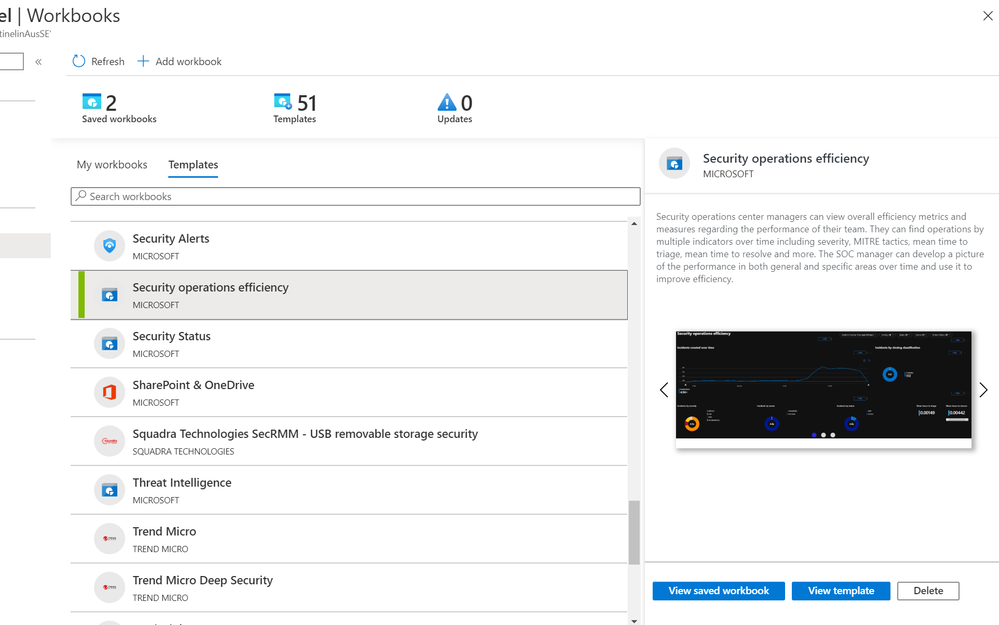
Microsoft Sentinel incident data is now available in your Log Analytics workspace! You can use this data to report on metrics within your Security Operations Center. Typical SOC metrics include incidents created over time, mean time to triage, mean time to closure, etc. With the new SecurityIncident table now available in Log Analytics you will be able to run queries to get the metrics that are operationally important for your SOC. In addition, we’ve added the Security Operational Efficiency workbook into your templates so you have a pre-built SOC metrics workbook out-of-the-box for you to use. We also have an accompanying video for this blog that can be accessed here.
How do I use the new SecurityIncident table?
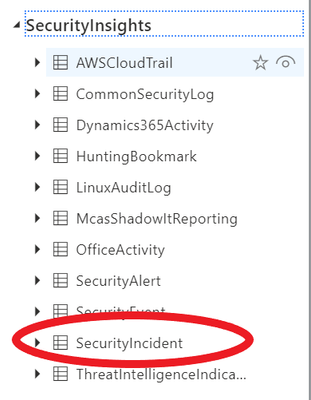
It’s easy: the SecurityIncident table will have been automatically created in your Log Analytics workspace when you have Microsoft Sentinel set up over said workspace. You can see the SecurityIncident table if you go to the Log Analytics blade:
You can query this table as you normally would query any other table using KQL.
Log entries in the SecurityIncident table
Every time you update an incident, a new log entry will be added to the SecurityIncident table. This allows for querying the changes made to incidents and allows for even more powerful SOC metrics, but you need to be mindful of this when constructing queries for this table as you may need to remove duplicate entries for an incident (dependent on the exact query you are running).
For example, if you wanted to return a list of all incidents sorted by their incident number but only wanted to return the most recent log per incident, you could do this using the arg_max KQL operator*:
List incidents by incident number
SecurityIncident
| summarize arg_max(LastModifiedTime, *) by IncidentNumber
*For more information on the arg_max and other KQL aggregation functions, please see here.
Another couple of query examples using this table are below:
Mean time to closure
SecurityIncident
| summarize arg_max(TimeGenerated,*) by IncidentNumber
| extend TimeToClosure =  (ClosedTime - CreatedTime)/1h
| summarize 5th_Percentile=percentile(TimeToClosure, 5),50th_Percentile=percentile(TimeToClosure, 50), 90th_Percentile=percentile(TimeToClosure, 90),99th_Percentile=percentile(TimeToClosure, 99)
Mean time to acknowledge
SecurityIncident
| summarize arg_max(TimeGenerated,*) by IncidentNumber
| extend TimeToTriage =  (FirstModifiedTime - CreatedTime)/1h
| summarize 5th_Percentile=max_of(percentile(TimeToTriage, 5),0),50th_Percentile=percentile(TimeToTriage, 50), 90th_Percentile=percentile(TimeToTriage, 90),99th_Percentile=percentile(TimeToTriage, 99)
Security Operational Efficiency workbook
To complement the SecurityIncidents table, we’ve provided you an out-of-the-box security operational efficiency workbook template that you can use to monitor your SOC operations. The workbook contains the following metrics:
- Incidents created over time
- Incidents created by closing classification, severity, owner and status
- Mean time to triage
- Mean time to closure
- Incidents created by severity, owner, status, product and tactics over time
- Time to triage percentiles
- Time to closure percentiles
- Mean time to triage per owner
- Recent activities
- Recent closing classifications
You can find this new workbook template by navigating to the “Workbooks” blade in Microsoft Sentinel and selecting the “Templates” tab.
We will be releasing additional workbooks that use the information found within the SecurityIncidents table in the near future, so watch this space!
Get started today!
We encourage you to use the new SecurityIncident table to get stats for your SOC and how incidents are being handled. If you make some interesting workbooks, please share them here on our GitHub repo with the community. Try it out and let us know what you think!
You must be a registered user to add a comment. If you've already registered, sign in. Otherwise, register and sign in.

