Usage reporting for Azure Sentinel
Published Mar 31 2020 05:56 AM 33.3K Views
Microsoft

Update:

3rd March 2021: This workbook is now available in the Azure Sentinel portal as a Template or you can still find it in my GitHub (see below) 
add_wsu.jpg

16th September 2020: There has been an issue with a name convention I used in this workbook, you will need to download v1.4.4 and above as fix to the issue.   Please upgrade if you see this error: "union named column name: TableName already exists"

Screenshot 2020-10-15 192912.jpg


From the above screenshot you can see you can select your Subscription and Workspace(s).  
The first part of the report, shows a Workspace or many if you select <unset> in the workspace drop-down. 

Annotation 2020-03-31 105957.jpg

This report is using Azure resource Graph (ARG) data, so it retrieves data like the retention and licence used.  You can also see (if known) who last set the licence and what licence scheme you're on.  If you have Sentinel assigned to the the workspace, you can probably adjust your retention from 30days to 90days for free, so I make a note of that.  Please do check before you make changes.


Download and Install:

Please download the Workbook from my Github  read the import instructions here readme 

  •  v1.4.0 Added Checks Tab for Daily, Weekly and Monthly suggested checking routines.  Thanks to Rod Trent, the Workbook aligns to his and the community suggested checks, Daily, Weekly & Monthly  https://secureinfra.blog/2020/03/19/suggested-daily-weekly-and-monthly-tasks-for-azure-sentinel/
  • v1.4.4 Quick fix: There has been a recent clash, with the prime query table name I used in this workbook and therefore I have renamed "TableName" to "TableName1". 

  • v1.4.6 In case you are interested I skipped releasing v1.4.5, this release has Moved Price to the Costs Analysis Tab (all pricing is now in the same place).  I added some table data, description and links to the Latency grid. Filter on Queries in Weekly report and Workspace audit filters.  + many more tweaks.
    I have also moved back to using 'Usage' in the workbook name, you can call it anything you like of course.  I prefer 'Workspace Usage Report'.  You can deploy from json as usual , however from this release I added a [Deploy to Azure button] in the GitHub so you can deploy the latest version with ease (thanks @paul collins!).
  • v1.4.8 [Cost Analysis] is now a Tab with Sub Menus to aid load times and readability.
    New features: Syslog Cost Analysis, CEF Cost Analysis, in the [OverView] sub menu, there are now reports on capacity / price per Subscription, Resource Group and Tags (Tags, needs needs more work in the next version).
    The Azure Sentinel tab, has reports for Usage vs. Capacity Reservation and recommendations for the reservation settings you are on, for Log Analytics and Azure Sentinel.

Tab 1: Workspace Info 


The report then shows all the Tables you have (and a daily average in the the chart title).  

Screenshot 2020-10-15 193358.jpg
Next I have included the Table Size and Table entries reports from another workbook.  These are useful to see any pattern changes over the time period.


In the latest release (from v1.4.6) I have included an "Advanced Details" section.  Examples are LAQuery audit information - who ran a query, when and how much resource did it consume?   You can see which worked and failed and any poor performers - maybe ones with high CPU time can be improved on?  Note, you do this data source to be enabled, there is a link to the docs displayed.


Tip; If you toggle "Help" to YES - there are 3 hidden queries near the top of the page, that display some helpful troubleshooting data (if it exists).

Tab 2: Latency 

The latency report is similar to the info one in Tab1.  Here I show the Average, Minimum and Maximum latency information for each Table.  You can press the column heading to sort the results.


Annotation 2020-03-31 111210.jpg

I have added some extra table information in a new column, showing information about many of the tables (not all...I'll add more later as well as some links to the docs).  I do need to revisit this section to make sure its 100% up to date on a regular basis.


Next we show (please select a Computer from the list), this shows it's Heartbeat data, this view is based on the default Agent Health workbook (see Azure Monitor Workbooks), but in the right-hand graph this shows the latency info, for both the Computer and the Agent (they can be different)

Annotation 2020-03-31 111540.jpg


Tab 3: Cost Analysis (formally just called Costs)

This tab, as the name suggests give you some insights into Costs, I have moved the PRICE feature to this tab now, as it makes more sense to be here.  March 2021, there are now a few extra Tabs below this one, for new data types, like Table Analysis, Syslog and CEF - but also to break the workbook up to improve load times.
For costs you need to put in a default value: 4.0 is used.  Follow the tip, or open help for more info on this feature.   Azure Sentinel (if you are in the Azure Sentinel costs tab) has its own Price option, just so you can see the specific costs for this service, default is 2.0.

Screenshot 2020-10-15 194051.jpg


The first graph, looks a little like the Overview one in the first tab - but this is showcasing the Table sizing metrics and Table pricing.  The Table price is an estimate on the Price figure you entered above - "4.0" being the default.  This gives you at 'at a glance' view of the Table size, is it billable and also a estimate of cost (based on the price you provided). 
Please use the Azure Pricing Calculator for a estimate.

Screenshot 2020-10-15 194248.jpg

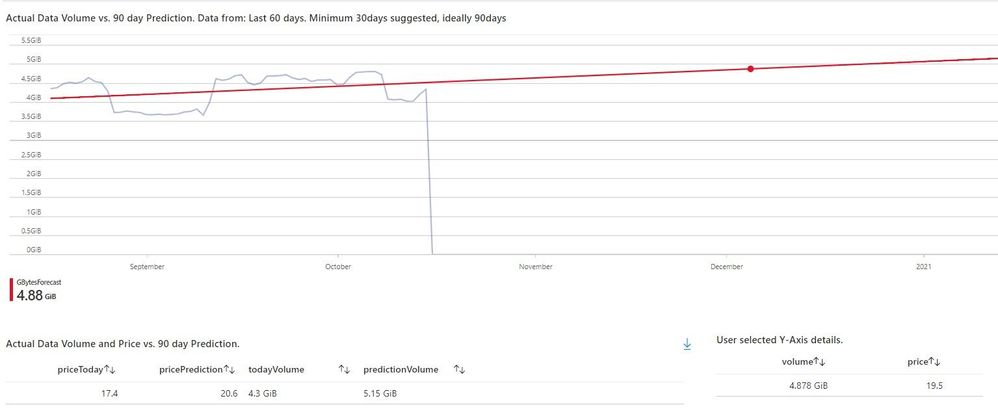
Next is a capacity trend, projecting forward 90days to give you a hint as to the ingestion trajectory you are on.

Note: the longer time span you select the better the slope will be, 30days+ ideally, however its a slow query and longer time span will slow it down more!  

From v1.4.6, in the grid below the graph (bottom left); I show the estimate price now and at the end of the trend line, plus the data capacities to match.
I also allow you to click the y-axis (red line) and in the grid (bottom right) you will see the data for the date selected - this example is for 5th December.  This can answer the question - how much data will I have on Dec 5th and what is the estimated price?

Screenshot 2020-10-15 194441.jpg


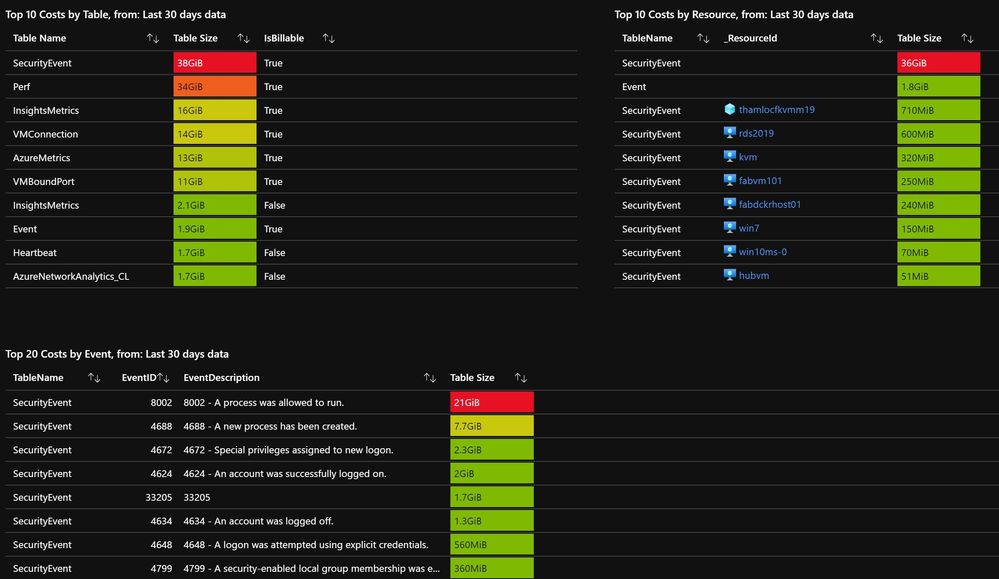
The next set of graphs, breakdown Top 10 costs by Table and by Resource, as well as Top 20 cost per EventID.  These can be very useful to spot a busy Computer or EventID that you may have.   
I have added new graphs to show the data change for the last few weeks, so you see how many GB's have been added or removed, and a % of change per week.


Annotation 2020-03-31 112619.jpg


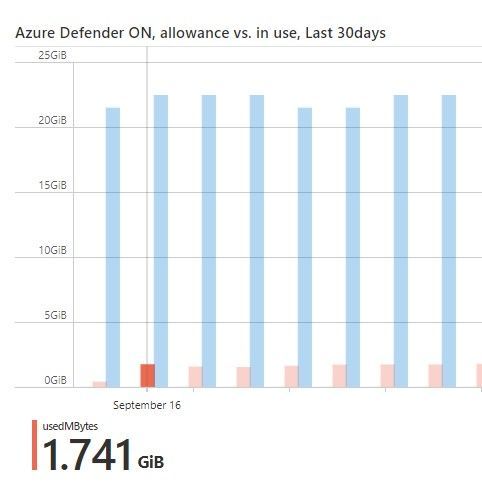
There is a section for Azure Security Center.   This is a good way to spot computers that are sending a lot of data from that solution.  Also is can show how much is sent by all ASC attached computers vs. the allowed allowance.  ASC allows for up to 500MB/day to be sent by a pool of computers.  You can see from my chart, I'm sending 1.7GB but I have the licence and headroom to send much more.  there is more on this topic in the built-in Helpfile.

Screenshot 2020-10-15 195111.jpg

Tab 4: Azure Sentinel 

The first display looks at the workspace used by Sentinel (and thanks to Paul Collins) shows when Azure Sentinel was added, and therefore how many days its been attached.   This is useful, especially if you are new to Azure Sentinel - as the free trial is 31days, so this can be a quick check to see how may days you have used.


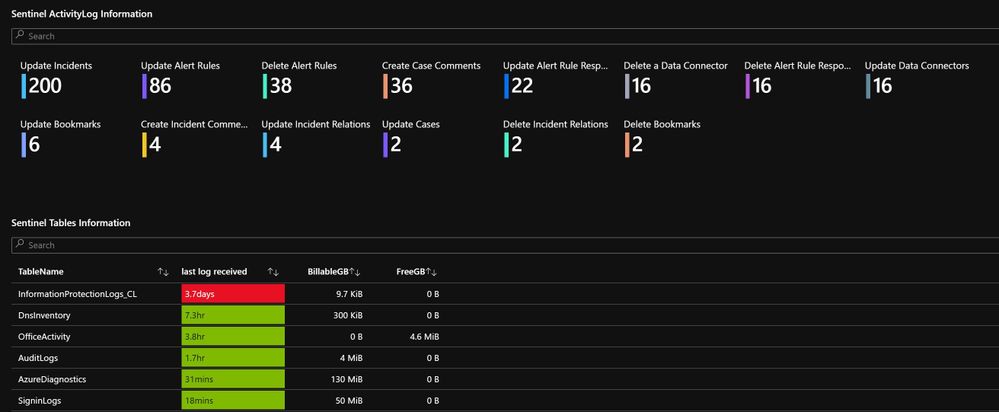
This tab also shows some details from Azure Activity logs as a tile view.    The bottom graph just shows specific Tables that Sentinel uses in the Log Analytics workspace.


Annotation 2020-03-31 113042.jpg

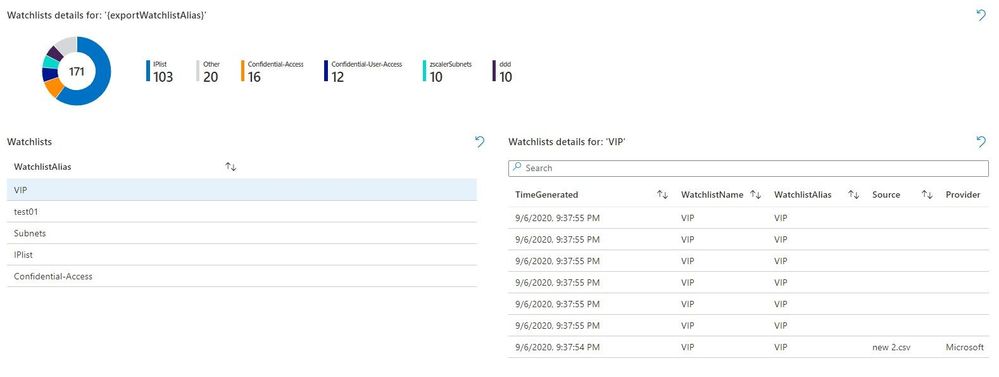
I have also added some view of the newly released preview of Watchlists.

Screenshot 2020-10-15 195817.jpg

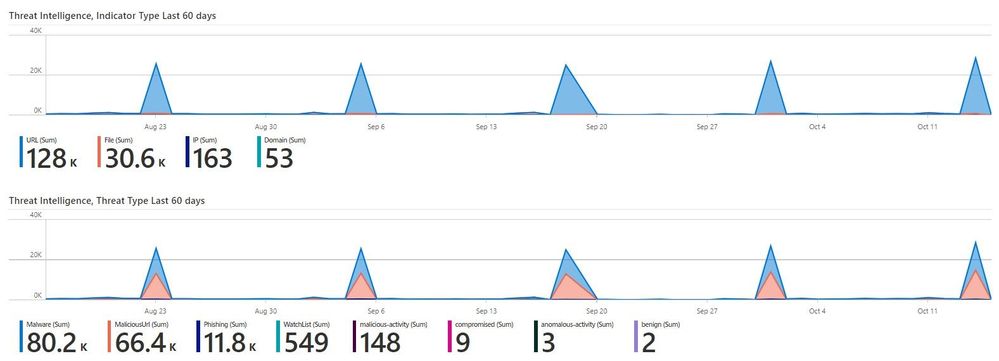
Then Threat Intelligence metrics - which types and count etc...

Screenshot 2020-10-15 195715.jpg

You can also see a View of Solution and Tables, this shows all Tables and the Solution name they are under (even non Azure Sentinel ones) - you can then select to see extra info.  And the final grid, is a list of the enabled Connectors that Azure Sentinel is using.


Tab 5: regular Checks

This gives you some Daily, Weekly or Monthly checks, based on the efforts of Rod Trent and the Azure Sentinel community.  Please read his blog for more details.  Note, I have tried to provide as many of these checks as a visualization, however some I cant (yet) do. 

https://azurecloudai.blog/2020/05/19/azure-sentinel-daily-task-data-connectors/


Summary:


This workbook has been many months in the making, and thanks to many people for testing and suggesting features.
Special thanks to @Gary Bushey and a few others for being loyal testers and providing great feedback.

22 Comments
Microsoft

Added v1.1 - to show Event Per Second (eps) details for all tables.  Thanks Yaniv Shasha and Kara Cole

Microsoft

Well done Clive very useful workbook!

it give the overview about the Sentinel's Ingestion Cost.

Many customer asked me in the past.

i suggest to include it by default into Sentinel 

Microsoft

@sifriger thanks for the feedback, and we taking about getting it added fairly soon.  

Microsoft

Added v1.2 - EPS by Device Vendor in CommonSecurityLog table (CEF)

Iron Contributor

Hi @CliveWatson, great details - could this also be used to track usage into Logic Apps as well?


We're looking into how we enable the lookup of the "Groups" a use is in, and this doesn't exist at the moment (??) so the options appear to be either:

  1. Use Logic Apps - possibly expensive on 14,000 Users?
  2. Use Azure Functions & Powershell into a Blob might be more affordable

A bit off topic, but it's also strange why this cannot be done thru the native connector or the Graph API?

Microsoft

Hi 


Group data isn't available, the connector is for logging not configuration, so even if there were log entries you may miss groups or their membership.  i.e. group created on Jan 1st, and you elected to only keep 3mths retention in your workspace  so you lose knowledge of it on 1st April.  That's why you need to check against the api or another trusted source. 


https://techcommunity.microsoft.com/t5/azure-sentinel/sign-in-logs-and-azure-ad-groups/m-p/1244996#M...


How often are you adding Groups / memberships, perhaps a Logic app/ PS / Function  that ran 1,2,4 times a day would be sufficient to populate a csv file?


Some logging data is obtained by these EventIDs (my list so I may have missed some)

// 4727 A security-enabled global group was created. 
// 4728 A member was added to a security-enabled global group. 
// 4729 A member was removed from a security-enabled global group. 
// 4730 A security-enabled global group was deleted. 
// 4731 A security-enabled local group was created. 
// 4732 A member was added to a security-enabled local group. 
// 4733 A member was removed from a security-enabled local group. 
// 4734 A security-enabled local group was deleted. 
// 4735 A security-enabled local group was changed. 
// 4737 A security-enabled global group was changed. 
// 4754 A security-enabled universal group was created. 
// 4755 A security-enabled universal group was changed. 
// 4756 A member was added to a security-enabled universal group. 
// 4757 A member was removed from a security-enabled universal group. 
// 4758 A security-enabled universal group was deleted. 
// 4764 A groups type was changed. 

SecurityEvent
| where EventID in (4727, 4728, 4729, 4730, 4731, 4732, 4733, 4734, 4735, 4737, 4754, 4755, 4756, 4757, 4758, 4764)
| summarize count() by EventID, Activity


Microsoft

Added v1.3a - EPS Tab added.  Graphs for Workspace Info and eps are also now in the same format 

Microsoft

Added v1.4 with suggested Daily, Weekly and Monthly checks - see link in the main post for the download
dwm-main.gif

Brass Contributor

@CliveWatsonSaw this on your Azure Sentinel presentation, looks to be an awesome workbook.

Thanks :smile:

Copper Contributor

@CliveWatson 
Greetings. We implemented your great workbook (v1.4) for one of our clients and its been most useful thank you.

Unfortunately in the last couple of days something has changed and when they went to use it, it now comes up with 

Col_Sanders_0-1600208460489.png

Being fairly new to workbooks and kusto, I'm not really sure where to start with debugging this, or is it literally a case of needing to log a support ticket to resolve this?

Thinking someone must have messed with the workbook, I re-downloaded and recreated the workbook but still get the same error. 

I'm guessing (maybe wrongly) that it may be a new custom table that's been added in, though I'm not sure which one that may have been or how to identify it.

PS

Just going through the table names, the only thing I notice is there are two similarly named custom logs

Compromised_IP_CL

Compromised_URL_CL    

Microsoft

Hi @Col_Sanders , I should have a new version out today, to fix this. It is a name clash. It may not be as fully tested as I'd like, but I'm sure I'll get feedback if anything isn't working. 


Can you please try this and let me know?

https://github.com/CliveW-MSFT/KQLpublic/blob/master/KQL/Workbooks/WorkspaceHealth/Workspace%20Healt...


Thanks Clive

Copper Contributor

Hi @CliveWatson 
Thanks for such a rapid fix :) 
It does indeed work again thank you. 


I see you also "Added value to Y axis of [Cost] trend graph" which may have been in response to our request thru our local MS team ... thank you for that too.
Please permit me to provide a little "user perspective" on that for you.
Having any value on the y axes is definitely an improvement, so even having storage is more meaningful - thanks.

From a client perspective however, I know that having navigated to the Cost tab they were expecting to see a $cost projection on the y axes, based upon the Price field, rather than just a storage-projection value.
While I acknowledge the complexity of the calculation with retention duration settings etc. I think that is exactly where a projection graph like this would offer must user value. Food for thought in a future version perhaps.


Thanks too for providing a default value for the Price field, that makes it easy to do the workspace based calculation and plug that in as the default so it doesn't have to be re-entered at every use. 


Thanks again for the prompt service :) 

Microsoft

Great feedback @Col_Sanders - please post if you have more ideas?


I do want to rework the Cost tab (I also aim to do a little more with the data from ASC especially).  I had been making the changes to do similar to your suggestions, and things like the updated y-axis were part of that, so you got to see this a little earlier than I'd planned.
I'm being very careful not to re-invent the Azure Pricing Calculator, but I'm glad the default pricing value and updated cost(volume) prediction are valuable. 
Now I have the volumes in the graph, would something like the table below help, with a volume now, volume predicted and cost now and cost predicted work (this would need formatting, but you get the idea)?  
Annotation 2020-09-17 105738.jpg

@Col_Sanders if you DM me your email, I can share the revised version, if you'd like to test?  or use your Microsoft contact if you prefer?

Brass Contributor

Great work on the latest update @CliveWatson, I've updated it this morning and it is now working again.


Thanks very much :cool:

Microsoft

This is fantastic - I do not have access to the Sentinel Ninja training and Sales Plays - but a link to this workbook would be extremely useful to the consumers of both of those resources. 

Copper Contributor

@CliveWatson Thank you this is a great resource! Do you know if there's a way to get the Cost Data to display in the workbook if you're part of a reseller tenant? I assume not, but thought it couldn't hurt to ask! 

Microsoft

@jfran3 can you elaborate a little, you would see any Workspaces you have access to, via Azure Lighthouse , an account enabled for you or B2B.  So as a reseller I could see customers tenants / workspaces if they have allowed that - that would work already?

Copper Contributor

@CliveWatson just a simple single subscription, two Log Analytics workspaces, but we have no cost information populating the workbook. Perhaps this is something the reseller has configured to prevent? Our owner accounts don't even have access going through the Cost blade... which I always thought was a bit strange. 

Copper Contributor

@CliveWatson thank you for your posting it's awesome. Anyway I have managed to follow your instructions and managed to download a document with the our data usage, please find it the results below, but what l want to know is how to calculate the data in the below


Table NameTable SizeTable EntriesSize per EntryIsBillableLatest Record Created
CoreAzureBackup9878942364417.8908629True3642
Alert4976743691348.710027True12654
AddonAzureBackupStorage349749840416.3678571True41934
Usage239186607394.0461285False11161
AddonAzureBackupProtectedInstance165717420394.5642857True41934
AddonAzureBackupJobs125164217576.7926267True13117
AddonAzureBackupPolicy63808172370.9767442True42485
Microsoft

Hello Philemon_7117, are you asking for the KQL behind this report, or something else?  Can you expand on  'how to calculate the data in the below' ?  Maybe you need another column with some calculation?  Or is it an explanation of what the columns (titles) are?

Thanks Clive

p.s the latest release should be in the Azure Sentinel portal, look for the upgrade now message to v1.4 

Copper Contributor

Hello, I am trying to open the above links but I get 404 (for example Added v1.2)

I am trying to extract monthly usage for a single device.

Microsoft
Version history
Last update:
‎Nov 02 2021 05:52 PM
Updated by: