- Home
- Security, Compliance, and Identity
- Microsoft Sentinel Blog
- Creating digital tripwires with custom threat intelligence feeds for Azure Sentinel
- Subscribe to RSS Feed
- Mark as New
- Mark as Read
- Bookmark
- Subscribe
- Printer Friendly Page
- Report Inappropriate Content
Azure Storage allows you to store all kinds of data in the cloud. By default, this data is private or constrained to authorized accounts, but Azure Storage also allows you to share data worldwide. If you have a webapp that needs access to files or you want to stream images or documents to your customers, then you can use Azure cloud storage to rapidly deliver this content via a simple URL.
But what if this sharing was not intended? What if an organisation had inadvertently stored sensitive information in a publicly available location? Recent public disclosures have shown that a variety of threat actors are actively looking for misconfigured services, in many cases making use of scanning tools to find misconfigured storage accounts and exploring their contents. What if you could find these actors?
In this blog I’ll describe how to use Azure Storage diagnostics and Azure Sentinel to set up monitoring of storage accounts. This can be used as a way of monitoring for actors scanning for open storage accounts. If you don’t have an existing storage account or want to set up one specifically to monitor bad actors, I’ll show how to create specially crafted storage blobs called ‘honey buckets’.
A honey bucket is a publicly available storage service, but not actually used in any production environment. Instead it is used as a digital tripwire to monitor for unauthorised access. An organisation might set up a service like this to collect threat intelligence or monitor for attacker reconnaissance activity against their organisation. We aren’t sure who coined the name, but the first use seems to come from Adel K (@0x4d31) on Twitter.
Much of the functionality I’ll describe in this blog post is already covered by ATP for Azure Storage, Microsoft’s cloud-based security solution. If you are not interested in collecting, managing and leveraging your own raw threat intelligence feed consider using the managed solution that automatically offers protection against cloud-based threats.
If you want to collect raw threat intelligence yourself, I’ll describe how you can use Azure Storage to:
- turn on the necessary diagnostic logs or apply this to your own Azure Storage containers.
- query the logs and extract useful fields.
- consume these logs and store them in Azure Sentinel.
- write an Azure Sentinel analytic to create an incident when a new IP is seen accessing your infrastructure.
Turning on Azure Storage diagnostic logs will result in increased storage usage and as such higher costs. You might want to try a honey bucket first before using this technique on production storage accounts.
Create your bucket
First, we will need to create a storage account and container (blob) for monitoring. If you haven’t used Azure Storage before you can follow the ‘Create a storage account’ documentation - as well as the Quickstart guide. If you already have Azure Storage accounts and want to enable monitoring, you can skip this step and continue from the ‘Set up debug logging’ section.
Crucially you will want to use an easily guessable storage account name. This way the storage account is more likely to be found by nefarious individuals. Several existing tools exist to scan for insecure configurations, these tools may have wordlists which will be a good place to choose a name from.
|
|
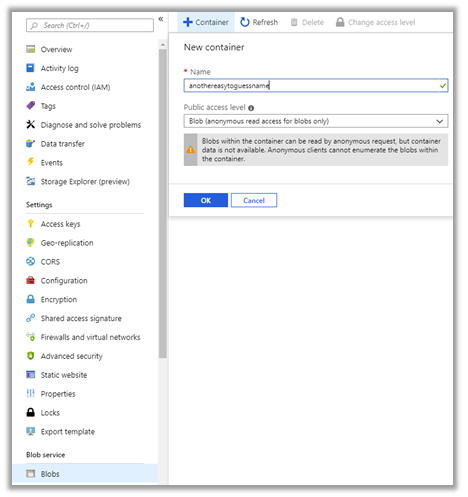
Next you will want to create a new container. This container will be publicly readable and will similarly need an easily guessable name. Once this has been created you may optionally want to add some blobs to the container for a would-be attacker to download.
 |
You may want to disable the ‘Secure transfer required’ to enable your container to be accessed over HTTP as well as HTTPS. Be aware of the security risks you may be opening yourself up to if you are applying this to an existing container.
Now we’ve worked to undo the default security put in place by Azure Storage we can continue and enable debug logging.
Enable debug logging
Azure Storage can log many of the interactions that occur with either the API or the webservice, potentially resulting in a large volume of logs and associated storage cost. The cost associated is related to the number of log entries that are created, with every access creating an entry. Azure Storage account users with a high number of requests should exercise caution. As such this feature needs to be specifically enabled.
Enabling diagnostic logging after you’ve created your blob storage, and added any necessary files, will reduce the number of resulting logs. Enabling diagnostics is performed by accessing ‘Diagnostic settings’ from storage account menu. Below you can see logging has been enabled for Read access and that only the last days’ worth of logs will be available. Once you’ve updated your blob logging properties don’t forget to click ‘Save’.
 |
At this point a new container called ‘$logs’ is created to store the audit events. This container is not visible in the Azure portal. If you want to inspect these logs, you’ll need to use the Azure API or the Azure Storage Explorer application.
The format for the log file is documented here. Of interest is the ‘requester-ip-address’ field, which holds the IP address of the entity that accessed the blob data. The ‘user-agent-header’ field which contains the user agent or whatever accessed the blob and the ‘request-start-time’.
 |
In your organisation the IP address or geolocation of your users may be well understood. As such examining these IPs may give you an indicator of possible recon behaviour. With a ‘honey bucket’ the storage account is never advertised or used, so an IP address that appears in this log is of interest.
Note: It isn’t just external entities which generate Azure Storage logging information. The Azure portal, Azure Storage API or other products such as Azure Storage Explorer could all generate log entries.
Getting the data into Azure Sentinel
At this point we will import these logs to Azure Sentinel to enable analysis. We can use an Azure Function to query the log files, extract the information and add this to the Azure Sentinel workspace. A sample Azure Function and installation instructions can be found in the Azure Sentinel GitHub page under the DataConnectors directory.
Diagnostic events are not written to the storage account in real time, it can take up to one hour for events to be available. The sample function runs once an hour, gathers the previous logs and examines them for List or Get operations.
As mentioned in the previous section, anything accessing the storage account could inadvertently add logging entries, this includes collecting the logs themselves. The sample Azure function does a reasonable job of whitelisting these to reduce false positives. It collects log entries of interest and adds the results to a custom Azure Sentinel table called ‘HoneyBucketLogs_CL’.
Threat hunting with Azure Sentinel
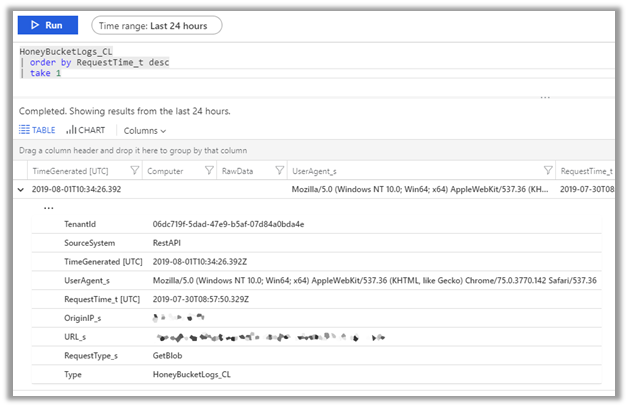
With the logs now in Azure Sentinel you can easily query the data and correlate with other sources.
 |
Executing a query like:
HoneyBucketLogs_CL
| order by RequestTime_t desc
| project OriginIP_s, UserAgent_s
will return all the IP addresses and corresponding User Agents that triggered the honeybucket ‘tripwire’. These could be correlated against audit data from legitimate storage logs, Azure Active Directory sign-in events, or other log sources such as web application firewalls. The Azure Sentinel GitHub repository is a great source of inspiration for what you could query with a UserAgent or IP address.
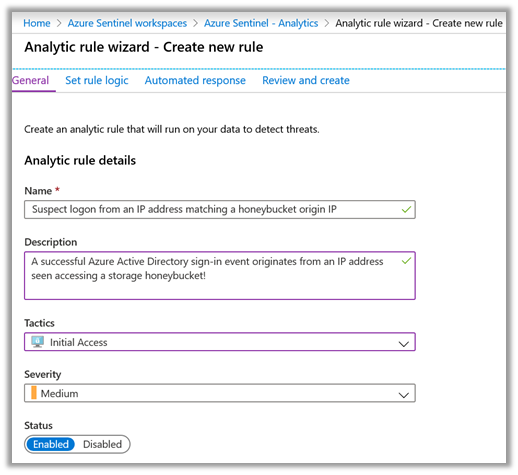
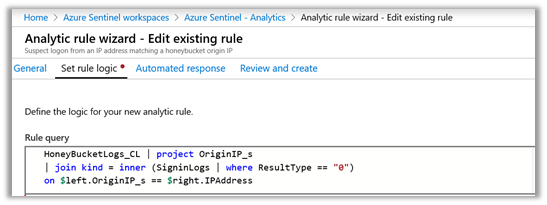
The example below shows correlation against Azure Active Directory successful sign-ins:
|
|
Final thoughts
If you are using cloud-based storage, it is crucial to understand who can access your data. By default, Azure Storage does not create publicly visible blob storage. Where wider data access is configured, Azure Storage gives customers detailed auditing capabilities.
ATP for Azure Storage is Microsoft’s cloud-based security solution that monitors, analysis and reports on anomalies in your organisation. ATP for Azure Storage adds an additional layer of security intelligence that detects unusual and potentially harmful attempts to access or exploit storage account. If you are interested in monitoring for the types of threats described in this blog post you may also want to configure Azure ATP for your storage account and connect this data into your Azure Sentinel workspace.
Microsoft’s Threat Intelligence Center proactively uses data sources and techniques such as those described here to discover emerging threats as well as to ensure that our detection coverage is relevant to the attacks facing both Microsoft and its customers.
You must be a registered user to add a comment. If you've already registered, sign in. Otherwise, register and sign in.


