- Home
- Security, Compliance, and Identity
- Microsoft Defender for Cloud Blog
- Time Indicators - Average Time taken to remediate resources
- Subscribe to RSS Feed
- Mark as New
- Mark as Read
- Bookmark
- Subscribe
- Printer Friendly Page
- Report Inappropriate Content
One of the important goals of Microsoft Defender for Cloud is to help you understand your current security situation. Microsoft Defender for Cloud continuously assesses your resources for security issues and flags a resource as healthy or unhealthy accordingly providing you recommendations.
Automation is not new in Microsoft Defender for Cloud, it reduces overhead and can improve your security by ensuring the process steps are done quickly, consistently and according to your predefined requirements. Azure Resource Graph and Microsoft Defender for Cloud's REST APIs gives you great capability to achieve this goal. We recently added two new time indicator fields to both Microsoft.security/assessments REST API provider and Azure Resource Graph to help you have more visibility into when was a resource first identified as unhealthy/healthy (firstEvaluationDate) and when the resource status changed to healthy/unhealthy (statusChangeDate) with the help of which, you can create automations around Cloud Security Posture Management (CSPM). Learn more about these fields here. The time-indicator fields makes it even more easy for you to automate and build your own playbooks for e.g., an automation my dear friend created recently to notify about new stale resources.
Today I want to introduce you to another automation that uses Time Indicators (firstEvaluationDate and statusChangeDate) to show the average time it needs for your resource owners to remediate a particular security control or recommendation.
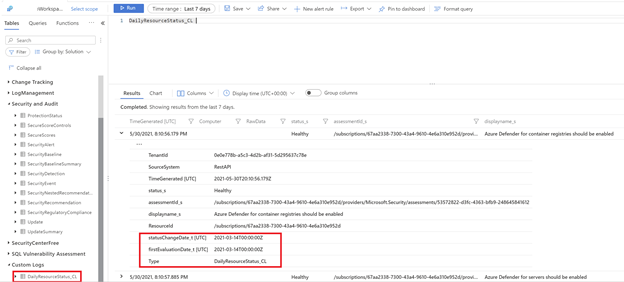
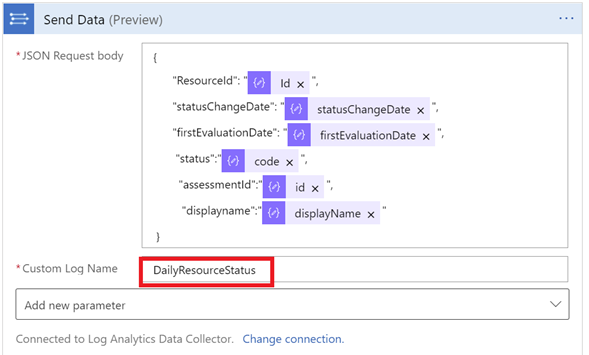
This playbook is configured to run every 24hrs to pull the assessment information from the API and exports the assessments identified by Microsoft Defender for Cloud to a custom log of the Log Analytics workspace

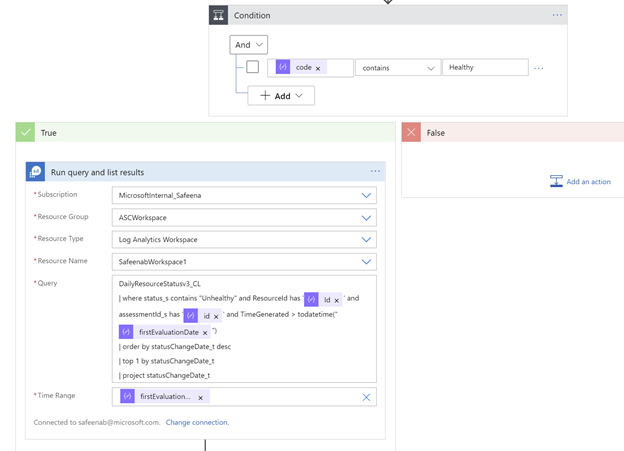
Since the Log Analytics workspace has the historical data now, the logic app starts by iterating all the healthy assessments of the resources and if the assessment status is found to be “healthy”, it queries the history to check if that resource was ever “unhealthy” and logs the previousStatus date.

The difference of these dates will be written to an array to calculate the average in the next loop.
The Logic App is using ticks, to calculate the specific timestamp inorder to get the average time. One of the challenges using the built-in date/time functions in Logic App, addToTime() or addSeconds(), is it can only handle as precise as seconds, while ticks provide ten million times more accurate values, which we lose a certain level of precision.

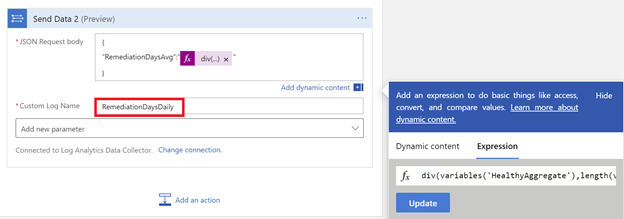
The output of the HealthyArray variable will be passed to an Aggregation loop to calculate the average time for all those resources whose previousState was unhealthy.
This value is passed to a to a custom log of the Log Analytics workspace which represents the average time taken to remediate the resources to better RCA for changes.

The playbook will also calculate the total number of unhealthy resources in the 24hrs period and the top ‘five’ security controls that are unhealthy in your environment and will then compose a new HTML email body and send it to the address(es) that you determine when deploying the automation to your environment.

Note:
Make sure to manually trigger the playbook once you've met all prerequisites. Since this Playbook creates a custom log in the Log Analytics Workspace, for the first few runs the logicapp will error out until there's data in the workspace for it to pull. Once the custom table gets populated in the workspace, you'll start receiving the results.
What are you waiting for? Go ahead and deploy this automation from our Microsoft Defender for Cloud Github repository using the provided ARM template and let us know your feedback.
Now that we have given you a good head start on how to use these fields, show us your creativity using the time indicators and don’t forget to let us know how these new fields (firstEvaluationDate and statusChangeDate) are helpful for you.
Acknowledgements:
Thanks to for @Miri Landau, @Ronny Keshet for envisioning this wonderful automation idea.
You must be a registered user to add a comment. If you've already registered, sign in. Otherwise, register and sign in.
