- Home
- Azure
- Azure Observability
- WVDCheckpoints table, how do I find out what server the user was on when entry made?
WVDCheckpoints table, how do I find out what server the user was on when entry made?
- Subscribe to RSS Feed
- Mark Discussion as New
- Mark Discussion as Read
- Pin this Discussion for Current User
- Bookmark
- Subscribe
- Printer Friendly Page
Jun 13 2021
02:39 AM
- last edited on
Apr 08 2022
10:49 AM
by
TechCommunityAP
- Mark as New
- Bookmark
- Subscribe
- Mute
- Subscribe to RSS Feed
- Permalink
- Report Inappropriate Content
Jun 13 2021
02:39 AM
- last edited on
Apr 08 2022
10:49 AM
by
TechCommunityAP
Hi,
I'm trying to debug an mystery slowness issue that is happening on random servers. The resources are all ok but the user experience is really slow for all users on the server. After restarting it it's fine.
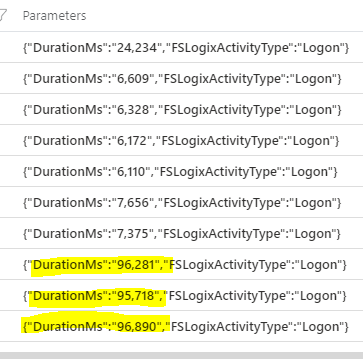
So far the only clue I've found in the logs is in the WVDCheckpoints table. On servers that are slow logins take 90k+ ms compared to the normal >10k ms. I'd like to write a query that uses this data but joins it or groups it by the the server so I can look back and find out when it started going slow. Then maybe I can look at other logs for clues in that time range.
What is the right way to join or group this table by session host?
Azure Monitor Logs reference - WVDCheckpoints | Microsoft Docs
I'd also like to set up an alert when logins are taking more than 30k+ ms.
Thanks in advance for any tips or pointing me to any documentation that could help.
- Labels:
-
Azure Monitor
- Mark as New
- Bookmark
- Subscribe
- Mute
- Subscribe to RSS Feed
- Permalink
- Report Inappropriate Content
Jun 13 2021 04:40 AM
I think I may have found my solution on this page:
https://blog.itprocloud.de/Windows-Virtual-Desktop-Monitoring-the-Spring-backend/
I just had to modify it a bit to add the filter by the host name and add the client IP.
WVDConnections
| where Type =~"WVDConnections" and State =~ "Started"
| extend Multi=split(_ResourceId, "/") | project ResourceAlias, ClientSideIPAddress, HostPool=toupper(HP=Multi[8]), SessionHostName , UserName ,CState=iff(SessionHostOSVersion=="<>","Failure","Success"), CorrelationId, TimeGenerated, ResourceGroup=Multi[4], DesktopGroup_s=toupper(strcat(RG=Multi[4],".", HP=Multi[8]))
| join kind= leftouter (
WVDCheckpoints
) on CorrelationId
| extend DurationFromLogon=datetime_diff("Second",TimeGenerated1,TimeGenerated)
| where Name=~"RdpStackLogon"
| where SessionHostName contains "hp1-1"
| project UserName, ClientSideIPAddress, SessionHost=SessionHostName, TimeStamp=TimeGenerated1, DurationFromLogon
| order by SessionHost, TimeStamp desc
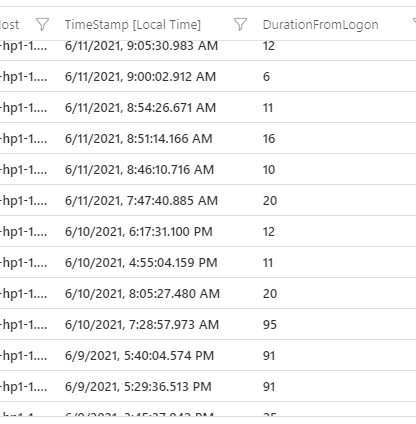
This will give me the login times and duration of the users on a server so I can find out when started getting slow. Here you can see how it improved after we rebooted it.
Now that I know what day it started I have to figure out where to look next to find out what is causing it. If you have any ideas please share. I'm pretty new at this.
In the mean time if you have any tips on how to set up an alert when logins take more than 20 seconds I'd also appreciate it.
- Mark as New
- Bookmark
- Subscribe
- Mute
- Subscribe to RSS Feed
- Permalink
- Report Inappropriate Content
Jun 13 2021 11:57 PM
+ New Alert Rule - hopefully, that allows you to configure the alert.
https://docs.microsoft.com/en-us/azure/azure-monitor/alerts/alerts-log
Server performance, can be caused by a multitude of things, but would look at:
Antivirus (exclusions, scheduled scan times, setup etc).
Is MS Teams running in WVD Optimized?
Has the OS been optimized? - https://github.com/The-Virtual-Desktop-Team/Virtual-Desktop-Optimization-Tool
Are there disconnected sessions taking up resources? http://woshub.com/remote-desktop-session-time-limit/
Good luck!

