- Home
- Azure
- Azure Observability
- Re: Log Analytics - VM availability (Metrics/chart)
Log Analytics - VM availability (Metrics/chart)
- Subscribe to RSS Feed
- Mark Discussion as New
- Mark Discussion as Read
- Pin this Discussion for Current User
- Bookmark
- Subscribe
- Printer Friendly Page
Jun 08 2020
12:20 AM
- last edited on
Apr 08 2022
10:28 AM
by
TechCommunityAP
- Mark as New
- Bookmark
- Subscribe
- Mute
- Subscribe to RSS Feed
- Permalink
- Report Inappropriate Content
Jun 08 2020
12:20 AM
- last edited on
Apr 08 2022
10:28 AM
by
TechCommunityAP
How to capture below Metrics specific to Virtual machine: Availability, Down planned/Unplanned and Unknown in %:
| Available | % |
| Down Unplanned | % |
| Down Planned | % |
| Unknown | % |
Using 'Heartbeat' or if any other way.
- Labels:
-
Azure Monitor
-
Log Analytics
- Mark as New
- Bookmark
- Subscribe
- Mute
- Subscribe to RSS Feed
- Permalink
- Report Inappropriate Content
Jun 08 2020 11:57 AM
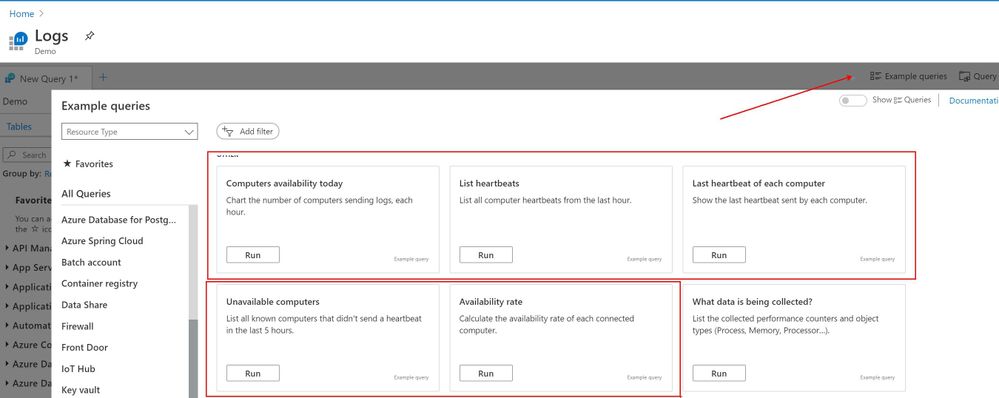
There are at least 5 or 6 examples in the the "Example Queries" section. You can try them in your own workspace or here https://ms.portal.azure.com/#blade/Microsoft_Azure_Monitoring_Logs/DemoLogsBlade
I'd suggest you also use an Azure Metric alongside Heartbeat (as heartbeat only tells you the Agent is working . not working). An Azure workbook is a good way of combining the data in a report.
