- Home
- Azure
- Azure Observability
- Re: Find requests source - ASP.NET Apps v4.0.30319\Request/sec
Find requests source - ASP.NET Apps v4.0.30319\Request/sec
- Subscribe to RSS Feed
- Mark Discussion as New
- Mark Discussion as Read
- Pin this Discussion for Current User
- Bookmark
- Subscribe
- Printer Friendly Page
Aug 30 2019
01:46 AM
- last edited on
Apr 08 2022
10:06 AM
by
TechCommunityAP
- Mark as New
- Bookmark
- Subscribe
- Mute
- Subscribe to RSS Feed
- Permalink
- Report Inappropriate Content
Aug 30 2019
01:46 AM
- last edited on
Apr 08 2022
10:06 AM
by
TechCommunityAP
Hello,
I have an Alert Rule set based on Log Analytics query to check RPS for my SharePoint application VMs

- Labels:
-
Azure Log Analytics
-
Azure Monitor
- Mark as New
- Bookmark
- Subscribe
- Mute
- Subscribe to RSS Feed
- Permalink
- Report Inappropriate Content
Aug 31 2019 04:14 AM
Is this data in the Office table?
OfficeActivity
| where OfficeWorkload == "SharePoint" - Mark as New
- Bookmark
- Subscribe
- Mute
- Subscribe to RSS Feed
- Permalink
- Report Inappropriate Content
Sep 02 2019 01:37 AM
Hello @CliveWatson
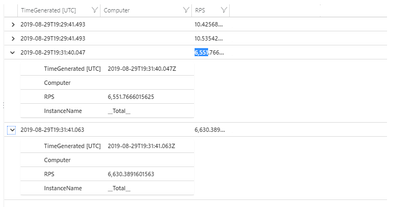
Here is a query I am using to get avg requests:
Perf
| where ( ObjectName == "ASP.NET Apps v4.0.30319" )
| where CounterName == "Requests/Sec"
| where TimeGenerated> ago(15m)
| project TimeGenerated, Computer, RPS=CounterValue
| summarize AvgRpsLast15Minutes= avg(RPS) by Computer
| where AvgRpsLast15Minutes > 10
I am monitoring those request to SharePoint Servers (SHP2013 on WindowsServer 2012R2).
I do not have Office in my LogManagement so I got syntax error for the query you suggested to check.
- Mark as New
- Bookmark
- Subscribe
- Mute
- Subscribe to RSS Feed
- Permalink
- Report Inappropriate Content
Sep 02 2019 02:19 AM
Hi @BartKos
We now have two crucial pieces of info, you are using the PERF table and RPS is a column you have defined that maps to "Request/Sec".
Your query if you don't run the final line, will show which computers have the spikes. I would probably look to the Events table (if you have it) and also check any system updates on those computers to see if a patch or change caused the spike.
You could use a query like this to see when the spikes first started or if there is a pattern (i.e. always on a Monday at 9am etc...)
Perf
| where TimeGenerated > ago(7d)
| where Computer in ("App04","App05")  // add in your computer names
| where ObjectName == "Processor"
| where CounterName == "% Processor Time" and InstanceName == "_Total"
| project TimeGenerated, Computer, RPS=CounterValue
| summarize AvgRpsLast15Minutes= avg(RPS) by bin(TimeGenerated, 1h), Computer
Test my query in the demo portal, just click:
Go to Log Analytics and Run Query
Note: I've used Processor/CPU data as I don't have any asp.net, so please adjust lines 4 and 5
- Mark as New
- Bookmark
- Subscribe
- Mute
- Subscribe to RSS Feed
- Permalink
- Report Inappropriate Content
Sep 02 2019 06:30 AM
Hello @CliveWatson
I have used your query ( I just changed time bin to 15 minutes)
Perf
| where ( ObjectName == "ASP.NET Apps v4.0.30319" )
| where CounterName == "Requests/Sec"
| project TimeGenerated, Computer, RPS=CounterValue
| summarize AvgRpsLast15Minutes= avg(RPS) by bin(TimeGenerated, 15m), Computer
| where AvgRpsLast15Minutes > 10
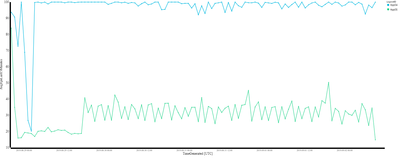
I have got below result (for last 48h):
I have checked Event tab for entries in the time of the occurrence of the one of spikes(nothing suspicious in my opinion which may cause such amount of requests), below results:
I have not noticed any patterns for last 7 days.
Is there a possibility to check the source or details of all the requests from the spike like IP address or maybe the name of the internal process or computer name? I know there are hundreds of req/s and it will require some digging but I would like to determine if there is some attack from outside (SharePoint app is dedicated for public users) or it is just some internal issue.
- Mark as New
- Bookmark
- Subscribe
- Mute
- Subscribe to RSS Feed
- Permalink
- Report Inappropriate Content
Sep 02 2019 09:04 AM
You might see a high count of 'something' in other tables at the same time? Here I'm looking at all Tables in the workspace but excluding "Perf" (you might need that one, but its shows the method - alternative is to name the tables as per line #5). I also supplied a time filter as your issues seems to be between two times, so we can filter out other data points with line 4. Ideally with your first few queries you'll have a list of computers - adding just those at line #3 will help filter away other computers.
union isfuzzy=true withsource = tt *
| where TimeGenerated > startofday(ago(7day))  // start from midnight
//| where Computer in ("App04","App05","App10")  // add in your computer names
| where TimeGenerated between (datetime('13:59:00') .. datetime('17:00:00'))
//| where tt in ("Event", "SecurityEvent")
| where tt !in("Perf")
| summarize count() by bin(TimeGenerated, 15m), tt, Computer
| sort by TimeGenerated asc
Do the above, Go to Log Analytics and Run Query
From the above graph we can hunt the next piece, we see that at 14:00 the Events and SecurityEvents are high you could no do something like
Event
| where TimeGenerated > startofday(ago(1day))  // start from midnight
| where Computer in ("App04","App05","App10")  // add in your computer names
| where TimeGenerated between (datetime('13:59:00') .. datetime('15:00:00'))
Repeat for the other tables.


