- Home
- Azure
- Azure Observability
- Re: VM Metrics Dashboard of workbook
VM Metrics Dashboard of workbook
- Subscribe to RSS Feed
- Mark Discussion as New
- Mark Discussion as Read
- Pin this Discussion for Current User
- Bookmark
- Subscribe
- Printer Friendly Page
Sep 24 2021
02:20 AM
- last edited on
Apr 08 2022
10:55 AM
by
TechCommunityAP
- Mark as New
- Bookmark
- Subscribe
- Mute
- Subscribe to RSS Feed
- Permalink
- Report Inappropriate Content
Sep 24 2021
02:20 AM
- last edited on
Apr 08 2022
10:55 AM
by
TechCommunityAP
Hi, We are ingesting VM metrics in to LAW.
I would like to have a workbook or dashboard that if i select a specific VM, it will show me the details I want to see only.
Currently, I can go in to Azure Portal > Virtual Machines > Select the VM > Monitoring/Insights > Performance Tab > and I can see the metrics I want. But, we would prefer to change some of those defaults, so we see:
CPU Utilization % : AVG / 95th / MAX
Available Memory : AVG / MAX
Logical Disk IOPS : AVG / 95th / MAX
Logical Disk Performance
Max Logical Disk Used %
The idea being that we can just select any vm and be shown these metrics over a given time range we choose.
I currently can only see how to pin these with a specific VM and not have a dashboard or something where once i choose the VM, it will show me all these details.
Is that possible?
Thanks.
Bytes Sent Rate : AVG / 95th / MAX
Bytes Received Rate : AVG / 95th / MAX
- Labels:
-
Azure Monitor
- Mark as New
- Bookmark
- Subscribe
- Mute
- Subscribe to RSS Feed
- Permalink
- Report Inappropriate Content
Sep 24 2021 02:28 AM
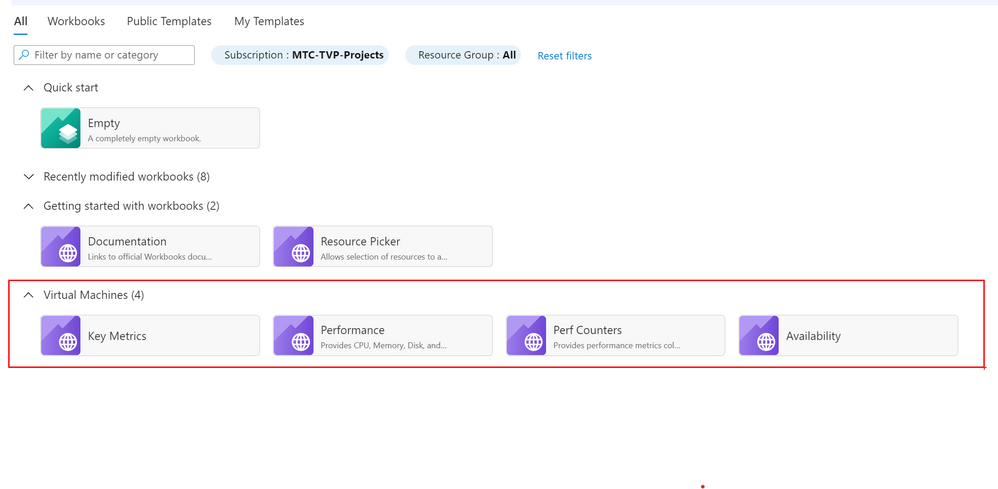
There are 4 Virtual Machine example workbooks. See:
Azure Monitor --> Workbooks
