- Home
- Azure
- Azure Observability
- Re: Physical memory or RAM usage in Percentage
Physical memory or RAM usage in Percentage
- Subscribe to RSS Feed
- Mark Discussion as New
- Mark Discussion as Read
- Pin this Discussion for Current User
- Bookmark
- Subscribe
- Printer Friendly Page
Jul 18 2019
05:14 AM
- last edited on
Apr 07 2022
06:00 PM
by
TechCommunityAP
- Mark as New
- Bookmark
- Subscribe
- Mute
- Subscribe to RSS Feed
- Permalink
- Report Inappropriate Content
Jul 18 2019
05:14 AM
- last edited on
Apr 07 2022
06:00 PM
by
TechCommunityAP
Hi Guys,
How to monitor the % Memory Used (Physical memory or RAM usage in Percentage) of Windows VMs in Azure monitors. In Log analytics workspace all I can see is “Available Mbytes” and “% Committed Bytes In Use” counters whose values are not matching my requirement. Anyone else is using any workarounds for this?
- Labels:
-
Azure Log Analytics
-
Azure Monitor
- Mark as New
- Bookmark
- Subscribe
- Mute
- Subscribe to RSS Feed
- Permalink
- Report Inappropriate Content
Jul 18 2019 07:02 AM - edited Jul 18 2019 07:13 AM
There is similar solution for Disk Space in Use and Capacity. Which looks like this for Memory:
Perf
//| where Computer startswith "DC02"
// add other computers here
| where ObjectName == "Memory"
| where CounterName == "Available MBytes"
| summarize GBFree=avg(CounterValue) by Computer,bin(TimeGenerated, 5m)
| summarize arg_max(TimeGenerated, *) by Computer
|join kind= inner
(
    Perf
    | where ObjectName == "Memory"
    | where CounterName == "% Committed Bytes In Use"
    | summarize PctFree=avg(CounterValue) by Computer,bin(TimeGenerated, 5m)
    | summarize arg_max(TimeGenerated, *) by Computer
)
on Computer
| project   TotalSizeGB=round(GBFree*100/PctFree,0),
            round(PctFree,2),
            round(GBFree,2),
            Computer
| summarize FreePCT=avg(PctFree) by Computer,
            TotalSizeGB,
            FreeGB = round(GBFree / 1024,2)
Go to Log Analytics and Run Query
However you will need some other data points. As the results look like this (just filtered on a single VM for ease)
Go to Log Analytics and Run Query
| Computer | TotalSizeGB | FreeGB | FreePCT |
|---|---|---|---|
| ContosoHotel2 | 204 | 0.17 | 87.45 |
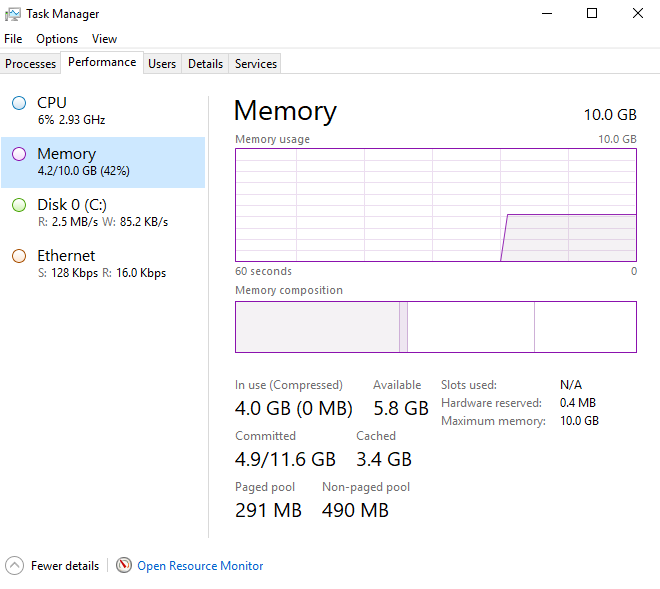
The final two columns are right, but the "TotalSizeGB" isn't right - you need to also subtract from that number the Cached Memory and the Paged Pool and the Non_paged Pool
You can see those 3 fields from Task Manager:
That's as far as I have time for now; I suspect we need a different counter or 3 more counters.
Maybe you are ok with the result, its not Physical RAM (as you asked for) but Total Available RAM inc cached etc...
FreePCT (Free %) is correct
- Mark as New
- Bookmark
- Subscribe
- Mute
- Subscribe to RSS Feed
- Permalink
- Report Inappropriate Content
Jul 18 2019 10:11 PM
i ran this query but it gives the exact value for FreeGB and the values for TotalSizeGB and FreePCT are not accurate.
- Mark as New
- Bookmark
- Subscribe
- Mute
- Subscribe to RSS Feed
- Permalink
- Report Inappropriate Content
Jul 19 2019 01:30 AM
Hello @roopesh_shetty
Mostly It looks correct to me, what time are you scoping the query on (default is 24hrs), are the numbers higher or lower than expected?
TotalSizeGB is wrong - I mentioned that, I'll let you find the correct counter(s) or method for that.
The query is a sample of the technique not the finished solution - so it might need some adjustment - sorry I didn't make that clearer in my response (it comes from a similar solution with disk space, where averages work fine, and the data fluctuates less).
The query uses averages where as if you look at Task Manager for example you get the actuals/avg over a small time window. The query is also time-wise behind the real machines (ingestion time delays etc...). In my case I used an RDS server and a DC that I know are pretty stable. FreeGb and PctFree seem ok, but I've not looked at them for very long. If your servers are busy and the values are fluctuating and you are measuring over 24hrs for instance then the averages maybe very different, perhaps scope to the last hour or even use the between operator to scope accurately. You may need to change the query from avg to max or whatever aggregation you require.
Thank you
