- Subscribe to RSS Feed
- Mark Discussion as New
- Mark Discussion as Read
- Pin this Discussion for Current User
- Bookmark
- Subscribe
- Printer Friendly Page
Dec 20 2018
05:09 PM
- last edited on
Apr 07 2022
05:34 PM
by
TechCommunityAP
- Mark as New
- Bookmark
- Subscribe
- Mute
- Subscribe to RSS Feed
- Permalink
- Report Inappropriate Content
Dec 20 2018
05:09 PM
- last edited on
Apr 07 2022
05:34 PM
by
TechCommunityAP
Hello all,
I'm creating some dashboards for people who are responsible for tracking groups of computers. I'm trying to avoid having to make a series of identical queries that only have a "where" clause limiting the query to a particular group.
I'd be OK doing the filtering either in the query itself or or after the fact with the filter controls.
An example query is as follows. This is pretty much right out of the documentation on groups. If this were a "real" query, I'd be using a group more limited that the one I chose for the example.
let MyComputers = ComputerGroup | where GroupSource == "ActiveDirectory" and Group == "Domain Computers" | distinct Computer;
Perf | where Computer in (MyComputers)| where ObjectName == "Processor" and CounterName == "% Processor Time"
| summarize AggregatedValue = avg(CounterValue) by Computer, bin(TimeGenerated, 60m)
Does anyone have some suggestions on how to accomplish this?
Thanks
- Labels:
-
Azure Monitor
-
Query Language
- Mark as New
- Bookmark
- Subscribe
- Mute
- Subscribe to RSS Feed
- Permalink
- Report Inappropriate Content
Dec 21 2018 02:29 PM
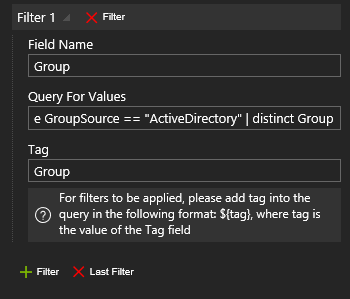
I will attempt to answer my own question here. I was able to get this partially working the way I want with the View Designer Filters functionality detailed here.
It seems to be what I'm looking for in this case, though the UI for users to specify filters is kind of clunky.
I created a filter named "Group" with the choices based on this computer groups query:
ComputerGroup | where GroupSource == "ActiveDirectory" | distinct Group
Then my query looks like this:
let FilterComputers = ComputerGroup
| where GroupSource == "ActiveDirectory" and Group == "${Group}"
| distinct Computer;
Perf
| where CounterName == "% Processor Time"
| summarize AggregatedValue = avg(CounterValue) by Computer, bin(TimeGenerated, 60m)
| where Computer in (FilterComputers) | sort by AggregatedValue desc
- Mark as New
- Bookmark
- Subscribe
- Mute
- Subscribe to RSS Feed
- Permalink
- Report Inappropriate Content
Dec 24 2018 02:44 AM
Solution1. Workbooks have a more interactive experience. We are slowly rolling them out to all Azure Monitor but right now they are accessible only from Application Insights and VM Insights: https://docs.microsoft.com/en-us/azure/application-insights/app-insights-usage-workbooks
2. Save the query as a function and use a variable for the group name. Set the variable before the call to the function (e.g. let groupname="mygroup";). Here is more on Log Analytics function: https://docs.microsoft.com/en-us/azure/azure-monitor/log-query/functions
- Mark as New
- Bookmark
- Subscribe
- Mute
- Subscribe to RSS Feed
- Permalink
- Report Inappropriate Content
Jan 17 2019 12:48 PM
Thanks for the suggestion on the functions and groups. That's going to make things a lot cleaner.
One thing that is causing me a problem is that I can't get a filter (e.g. ${Group}) to work in a query that is part of a dashboard. Specifically, a Line Chart and List dashboard.
This is the query:
Perf | where ObjectName == "LogicalDisk" and CounterName == "% Free Space" and InstanceName == "C:" and Computer in (${Group}) | summarize avg(CounterValue) by Computer, bin(TimeGenerated, 1d)
This is the error I get.... not super friendly, but it tells me the position at least.
(400) A recognition error occurred. Token: "==". Position: 153.
{"error":{"message":"The request had some invalid properties","code":"BadArgumentError","innererror":{"code":"SyntaxError","message":"Syntax Error","information":{"details":"{\"error\":{\"code\":\"Bad request\",\"message\":\"Request is invalid and cannot be executed.\",\"innererror\":{\"code\":\"SYN0002\",\"message\":\"A recognition error occurred.\",\"@context\":{\"activityId\":\"cafba42c-c450-4b16-8e8d-dae232e8f2df\"},\"@errorCode\":\"SYN0002\",\"@errorMessage\":\"A recognition error occurred.\",\"@token\":\"==\",\"@line\":\"1\",\"@pos\":\"153\"}}}"}}}}
This is the query I'm using for my filter (Query for Values). This works outside the dashboard and does return values for groups as expected.
ComputerGroup | where GroupSource == "ActiveDirectory" | distinct Group
If I take out the ${Group} and put in my group name that I made a function out of (devops_swhite) then the whole thing works... but no filtering.
Thanks
Accepted Solutions
- Mark as New
- Bookmark
- Subscribe
- Mute
- Subscribe to RSS Feed
- Permalink
- Report Inappropriate Content
Dec 24 2018 02:44 AM
Solution1. Workbooks have a more interactive experience. We are slowly rolling them out to all Azure Monitor but right now they are accessible only from Application Insights and VM Insights: https://docs.microsoft.com/en-us/azure/application-insights/app-insights-usage-workbooks
2. Save the query as a function and use a variable for the group name. Set the variable before the call to the function (e.g. let groupname="mygroup";). Here is more on Log Analytics function: https://docs.microsoft.com/en-us/azure/azure-monitor/log-query/functions

