- Home
- Azure
- Azure Observability
- Re: barchart Ignoring the ymin and ymax values
barchart Ignoring the ymin and ymax values
- Subscribe to RSS Feed
- Mark Discussion as New
- Mark Discussion as Read
- Pin this Discussion for Current User
- Bookmark
- Subscribe
- Printer Friendly Page
Jul 05 2019
05:16 AM
- last edited on
Apr 07 2022
05:59 PM
by
TechCommunityAP
- Mark as New
- Bookmark
- Subscribe
- Mute
- Subscribe to RSS Feed
- Permalink
- Report Inappropriate Content
Jul 05 2019
05:16 AM
- last edited on
Apr 07 2022
05:59 PM
by
TechCommunityAP
I know there is an open post but even that isn't closed. Along with these params many other properties also doesn't seem to work. e.g. legend
My query :
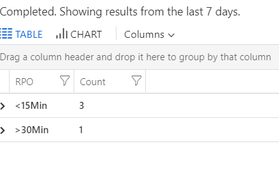
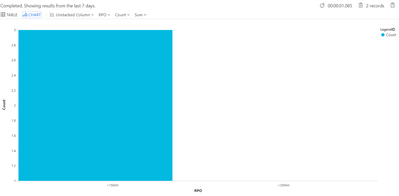
- Labels:
-
Azure Monitor
-
Query Language
- Mark as New
- Bookmark
- Subscribe
- Mute
- Subscribe to RSS Feed
- Permalink
- Report Inappropriate Content
Jul 05 2019 06:58 AM
Would this help?
AzureDiagnostics
    | where replicationProviderName_s == "A2A"
    | where isnotempty(name_s) and isnotnull(name_s)
    | extend RPO = case(
            rpoInSeconds_d <= 100,  "<15Min",
            rpoInSeconds_d <= 1000, "15-30Min",
                                    ">30Min")
    | summarize hint.strategy=partitioned arg_max(TimeGenerated, *) by name_s
    | project comp_list = name_s , RPO
    | summarize count(comp_list) by RPO, comp_list
| render barchart kind=stacked
- Mark as New
- Bookmark
- Subscribe
- Mute
- Subscribe to RSS Feed
- Permalink
- Report Inappropriate Content
Jul 08 2019 02:35 AM
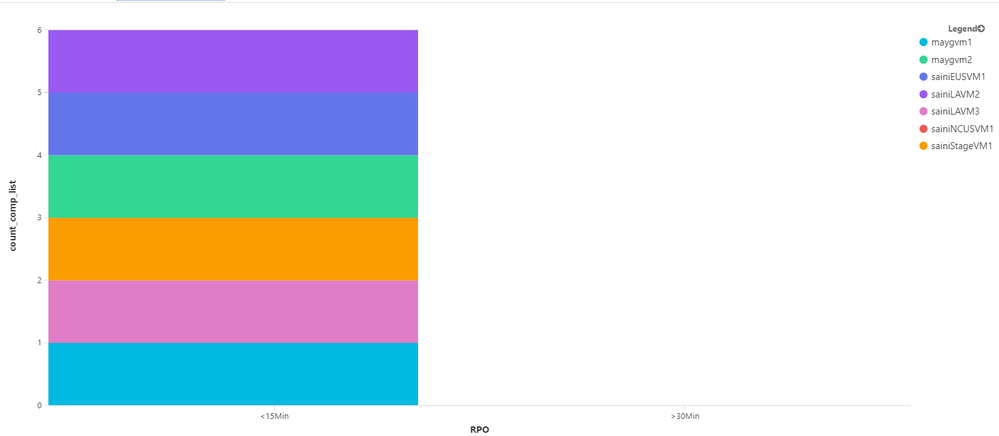
@CliveWatson : thanks for your reply but the output is still not as expected.
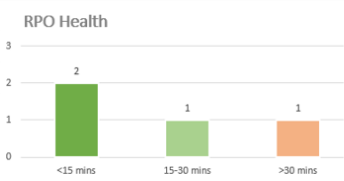
Elaborating the context here, I am trying to group the occurences based on time range showing the count of occurrences per range.
E.g. How many vm's have RPO time <15 min, how many between 15-30min and rest.
The output of the updated query looks below. unstacking just result in a bar of height 1.
- Mark as New
- Bookmark
- Subscribe
- Mute
- Subscribe to RSS Feed
- Permalink
- Report Inappropriate Content
Jul 08 2019 02:52 AM
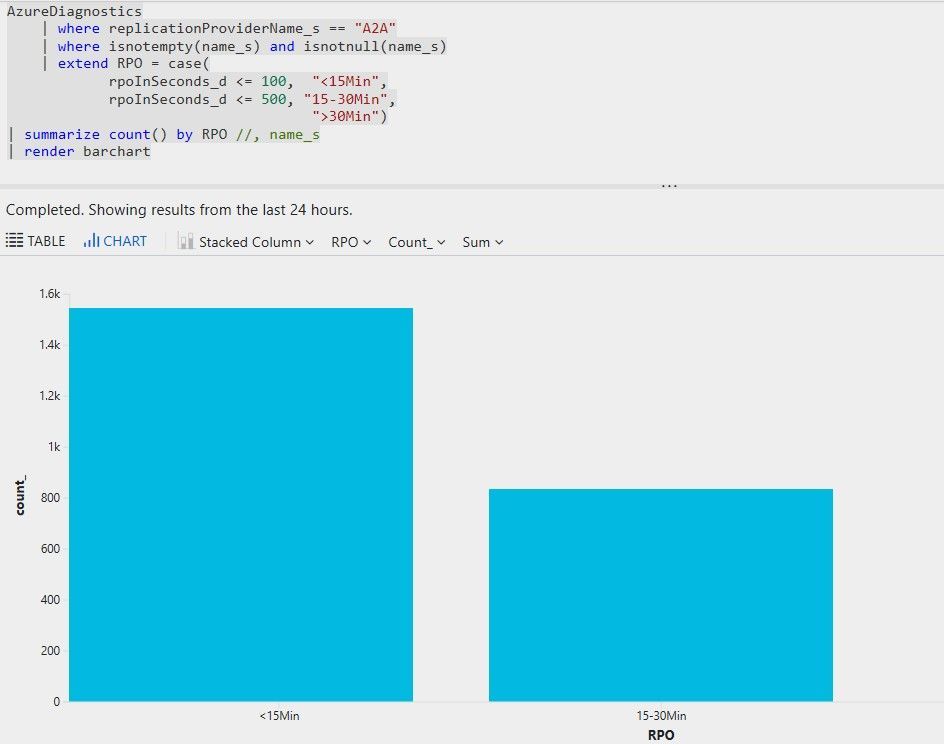
If its just a count, wouldn't this be enough?
AzureDiagnostics
    | where replicationProviderName_s == "A2A"
    | where isnotempty(name_s) and isnotnull(name_s)
    | extend RPO = case(
            rpoInSeconds_d <= 100,  "<15Min",
            rpoInSeconds_d <= 500, "15-30Min",
                                    ">30Min")
| summarize count() by RPO , name_s
| render barchart
or (hide the name_s)
Go to Log Analytics and Run Query
- Mark as New
- Bookmark
- Subscribe
- Mute
- Subscribe to RSS Feed
- Permalink
- Report Inappropriate Content
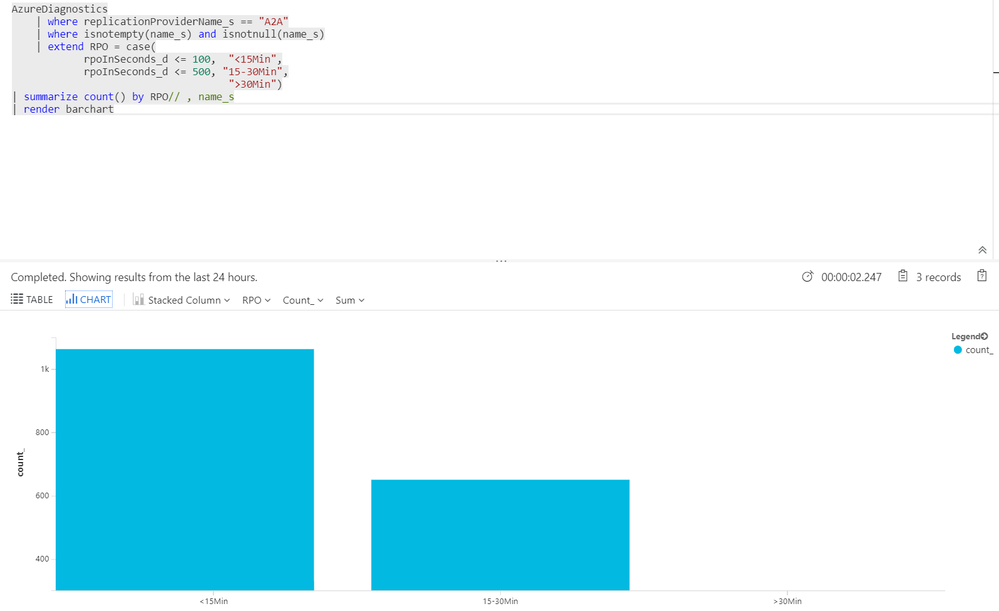
Jul 08 2019 04:16 AM
Hey @CliveWatson : The problem remains the same. due to yMin not being set to 0 I can never see the bar for the third range.
