- Home
- Azure
- Azure Observability
- Re: Azure Monitor for VMs - Service Map - Cannot expand Nodes
Azure Monitor for VMs - Service Map - Cannot expand Nodes
- Subscribe to RSS Feed
- Mark Discussion as New
- Mark Discussion as Read
- Pin this Discussion for Current User
- Bookmark
- Subscribe
- Printer Friendly Page
Mar 18 2020
01:32 PM
- last edited on
Apr 08 2022
10:20 AM
by
TechCommunityAP
- Mark as New
- Bookmark
- Subscribe
- Mute
- Subscribe to RSS Feed
- Permalink
- Report Inappropriate Content
Mar 18 2020
01:32 PM
- last edited on
Apr 08 2022
10:20 AM
by
TechCommunityAP
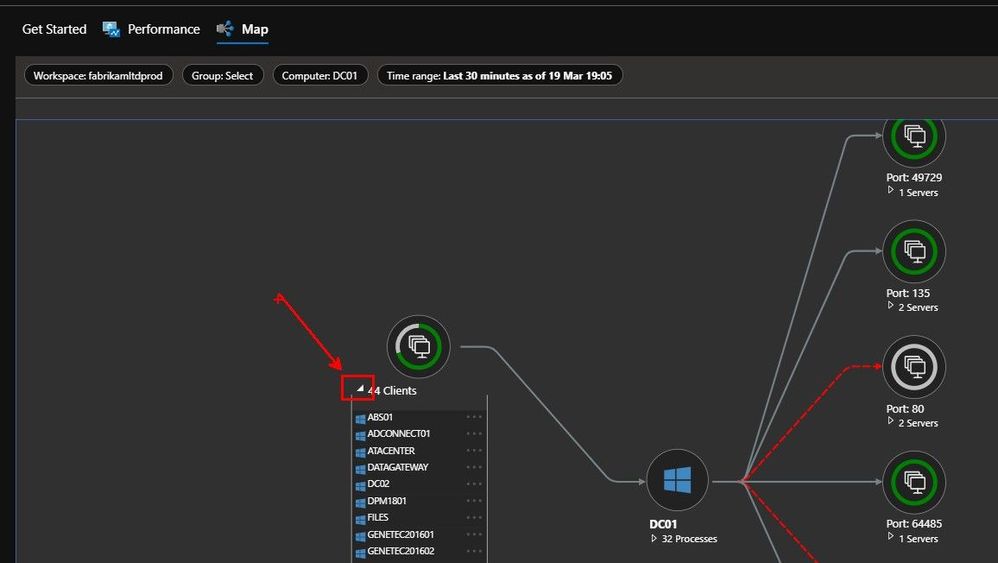
After provisioning Azure Monitor for VMs, data collection worked fine and service map was working properly under Insights for the respective VMs. Currently, nodes can't be expanded in the graphical view, so processes and servers can't be displayed in the map. When clicking Expand Node nothing happens, same when clicking the triangle icon to expand. When trying to the current VM's node, all items in the view get ordered in a grid pattern, connection lines disappear and no additional info is displayed. We've tried this in different browsers (firefox, chrome, edge) on different machines with different accounts - same issue everywhere. The Issue started about a month ago, but it has worked for us before (and I might add it's a pretty cool tool when it works, e.g. to quickly give customers/stakeholders/newly onboarded people/support insights).
- Labels:
-
Azure Monitor
-
Service Map
- Mark as New
- Bookmark
- Subscribe
- Mute
- Subscribe to RSS Feed
- Permalink
- Report Inappropriate Content
Mar 19 2020 01:57 AM
@Deleted
Are you using Service Map from Log Analytics or VM Insights, try VM Insights as linked to in the portal.
- Mark as New
- Bookmark
- Subscribe
- Mute
- Subscribe to RSS Feed
- Permalink
- Report Inappropriate Content
Mar 19 2020 10:11 AM - edited Mar 19 2020 10:15 AM
I'm using it from VM's blade > Monitoring (category) > Insights, where "Map" is the default view. We don't have the Service Map solution enabled in the Log Analytics workspace.
Edit (3m after post): I've also used CTRL+F5/private modes/cleared cache on the browsers, just in case. Issue persists.
- Mark as New
- Bookmark
- Subscribe
- Mute
- Subscribe to RSS Feed
- Permalink
- Report Inappropriate Content
Mar 19 2020 12:11 PM
@Deleted
So this never expands?
Do you get anything when you open the workbooks? You have the dependency agent installed ok as well, as the Microsoft Management Agent ?
- Mark as New
- Bookmark
- Subscribe
- Mute
- Subscribe to RSS Feed
- Permalink
- Report Inappropriate Content
Mar 19 2020 02:27 PM
Exactly, the little expand/arrow icon as well as right click > expand node do not work as shown in your screenshot. They have however done so before, for the same VMs after we've provisioned the MMAExtension/DependencyAgentWindows or OMSExtension/DependencyAgentLinux extensions respectively.
However, at the time of writing this I have tried it again with the same VMs as during my last post earlier and it does work now. I think it may have been related to an issue with a data collection cap being hit on the Log Analytics workspace, regarding which I made a change in the meantime. I'll check with other users whom I encountered this issue with at the end of february; whether it's working properly again for them too.
- Mark as New
- Bookmark
- Subscribe
- Mute
- Subscribe to RSS Feed
- Permalink
- Report Inappropriate Content
Mar 21 2020 04:13 AM
It's working for us now - it seems like there might have been a lack of data or only partial data available, e.g. the nodes said "1 Server" or "7 Clients", but expanding the node returned no list of those items. The only thing I did between the inital post and it working again was to raise the daily data cap in the log analytics workspace. Thanks!
- Mark as New
- Bookmark
- Subscribe
- Mute
- Subscribe to RSS Feed
- Permalink
- Report Inappropriate Content
Mar 23 2020 02:06 AM
Hi, Glad to here its working now. Its always a challenge if you are data capping the workspace, as you cant be selective of the data that gets through (sounds like the expansion couldn't proceed as there wasn't data available) . Maybe you need to report on daily/weekly usage?
Example.
Go to Log Analytics and run query
let AllowedGBperDay = 5;  // Set an Alert threshold
union withsource=TableName *
| where TimeGenerated > startofday(ago(1d))
| where _IsBillable == True
| summarize Entries = count(), SizeGB = round(sum(_BilledSize / (1024*1024*1024)),2)  by TableName, _IsBillable
| order by SizeGB desc
| summarize AggregatedValue = sum(SizeGB)
// set to 1 (one) for threshold exceeded, which allows you to have an alert rule for gtr 0 (zero)
| extend AlertValue = iif(AggregatedValue > AllowedGBperDay,"1","0")
I use this in a Azure Monitor Alert.
