- Home
- Azure Data
- Azure Data Factory Blog
- Use Azure IR to Tune ADF and Synapse Data Flows
- Subscribe to RSS Feed
- Mark as New
- Mark as Read
- Bookmark
- Subscribe
- Printer Friendly Page
- Report Inappropriate Content
Azure Integration Runtimes are ADF and Synapse entities that define the amount of compute you wish to apply to your data flows, as well as other resources. Here are some tips on how to tune data flows with proper Azure IR settings.
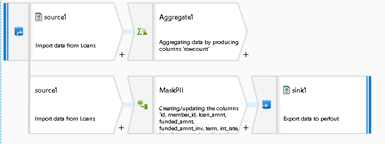
In all 3 of these examples, I tested my data flows with a demo set of mocked-up loans data in a CSV file located in my Blob Store container. There were 887k rows with 74 columns and in each case I read from the file, duplicated the data into 2 separate streams, 1 row aggregated a row count, and the 2nd row masked PII data with a 1-way hash. I then loaded the data into a destination blob store folder sink.
Each of these executions below was run from an ADF pipeline using the "Debug > Use Activity Runtime" setting so that I could manually adjust the number of cores and compute type for each run. This means that I am not using the warmed-up debug cluster session. The average start-up time for the Databricks cluster was 4.5 mins. I also left all optimization settings in the transformations to default / use current partitioning. This allowed data flows to rely fully on Spark's best guess for partitioning my file-based data.
Compute Optimized
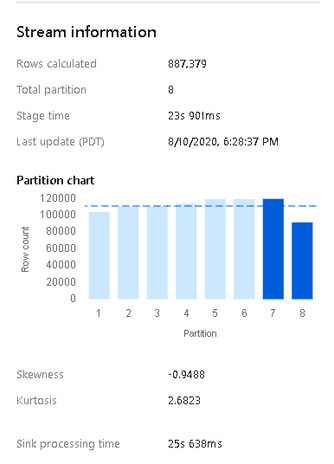
First, I ran the pipeline using the lowest cost option, Compute Optimized. For very memory-intensive ETL pipelines, we do not generally recommend using this category because it has the lowest RAM/Core ratio for the underlying VMs. But it can be useful for cost-savings and pipelines that are not acting on very large data without many joins or lookups. In this case, I chose 16 cores, which is 8 cores for the driver node and 8 cores for the worker nodes.
Results
- Sink IO writing: 20s
- Transformation time: 35s
- Sink post-processing time: 40s
- Data Flows used 8 Spark partitions based on my 8 core worker nodes.
General Purpose
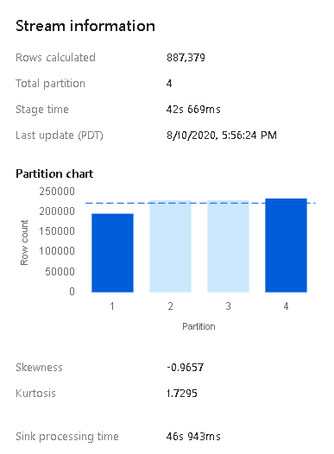
Next, I tried the exact same pipeline using General Purpose with the small 8 core (4+4) option, which gives you 1 driver and 1 worker node, each with 4 cores. This is the small default debug cluster you are provided with the Default Auto Azure Integration Runtime. General Purpose is a very good middle option for data flows with a better RAM-to-CPU ratio than Compute Optimized. But I would highly recommend much higher core counts than I used here in this test. I am only using the default 4+4 to demonstrate to you that the default 8 core total is fine for small debugging, but not good for operationalized pipelines.
Results
- Sink IO writing: 46s
- Transformation time: 42s
- Sink post-processing time: 45s
- Data Flows partitioned the file data into 4 parts because in this case because I backed out to only 4 worker cores.
Memory Optimized
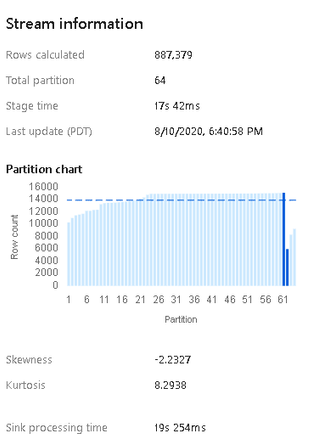
This is the most expensive option and the highest RAM-to-CPU ratio, making it very good for large workloads that you've operationalized in triggered pipelines. I gave it 80 cores (64 for workers, 16 for driver) and I naturally had the best individual stage timings with this option. The Databricks cluster took the longest to startup in this configuration and the larger number of partitions led to a slightly higher post-processing time as the additional partitions were coalesced. I ended up with 64 partitions, one for each worker core.
Results
- Sink IO writing: 19s
- Transformation time: 17s
- Sink post-processing time: 40s
You must be a registered user to add a comment. If you've already registered, sign in. Otherwise, register and sign in.


