- Home
- Azure Data
- Azure Data Explorer Blog
- How to identify queries send to Kusto from a specific Power BI report
- Subscribe to RSS Feed
- Mark as New
- Mark as Read
- Bookmark
- Subscribe
- Printer Friendly Page
- Report Inappropriate Content
How to identify the queries sent to Kusto/ADX from a specific Power BI report
Every query or command processed by the Kusto engine is logged to the cluster and can be analyzed by the commands
- .show queries
- .show commands
- .show commands-and-queries
The information is maintained for a month and contains detailed statistics that can help you identify queries that take excessive resources, queries that fail and usage patterns.
If you have a role of admin or monitor you can see queries send by all users, otherwise you can only see your queries.
See more here.
What if you want to identify queries sent by specific reports in Power BI?
You may want to do it to see the usage of each report or to monitor the performance of specific queries over time.
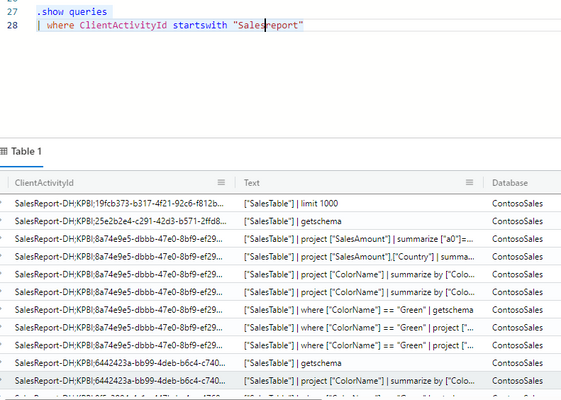
You can do it by adding a setting to the source statement in your queries.
It may look like:
AzureDataExplorer.Contents("help", null, null, [ClientRequestId="SalesReport-DH"])
The value provided by ClientRequestid will be used as a prefix to ClientActivityId column in .show queries
In this way you can separate queries used by different reports.
You can add different prefixes to specific queries within one report.
My favorite .show queries script
As this article is short, I’ll include some bonus content
This is the KQL I use to analyze queries:
.show commands-and-queries
| where StartedOn > datetime(2022-11-08T07:32:14.0660138Z)
| where User ==current_principal_details().UserPrincipalName
| order by StartedOn asc
| extend delay=datetime_diff("Millisecond",next(StartedOn),LastUpdatedOn)
| extend delay=iff(delay<0 or delay> 5000,0,delay)
| extend MB=format_bytes(MemoryPeak)
| extend Isgetschema=Text has "getschema"
| extend IsPreview=Text has "limit 1000 "
| extend Len=strlen(Text)
| extend TextLength=strlen(Text)
| extend ScannedData=format_bytes(tolong(CacheStatistics.Shards.Hot.HitBytes))
| fork
Queries=(where CommandType =="Query" and Isgetschema==false and IsPreview ==false | project StartedOn, Duration, TotalCpu, ScannedData, MB,Text | order by StartedOn asc)
Commands=(where CommandType =="AdminThenQuery" | project StartedOn,LastUpdatedOn, Duration, TotalCpu, MB, ScannedData ,Text | order by StartedOn asc)
Detail=(project StartedOn,State,FailureReason, Duration, delay, TotalCpu,Isgetschema, MB, ScannedData,ClientActivityId, Text | order by StartedOn asc)
Slow=(where CommandType =="Query" | project Duration, TotalCpu, MB, ScannedData,Text | order by Duration)
Getschema=(where CommandType =="Query" and Isgetschema==true | project StartedOn,Text)
Summary=(summarize Commands=countif(CommandType =="AdminThenQuery"),Queries=countif(CommandType=="Query"),DelayCommand=sumif(delay, CommandType =="AdminThenQuery"),
DelayQuery=sumif(delay, CommandType =="Query"),mn=min(StartedOn),mx=max( LastUpdatedOn),TotCPU=sum(TotalCpu),TotDuration=sum(Duration)
| extend OveralDuration=(mx-mn))
Notice that I filter the queries only to my queries in cases I’m admin and I don’t want to monitor other user’s queries.
I use .show commands-and queries because in some cases the connector sends commands.
I use the fork verb to create multiple results based on the query.
At different times I wanted to see queries that use getschema and queries that are produced by the Power Query editor (IsPreview) and so I added special indications.
You must be a registered user to add a comment. If you've already registered, sign in. Otherwise, register and sign in.
