- Home
- Azure
- Apps on Azure Blog
- How to get a System.Net trace of your C# Web Job
- Subscribe to RSS Feed
- Mark as New
- Mark as Read
- Bookmark
- Subscribe
- Printer Friendly Page
- Report Inappropriate Content
Overview
In Azure App Services C# based Web Jobs, you can see the network traffic that is using the System.Net socket and related .Net classes using this functionality. This should be only used to temporarily grab traces as the log will grow quite large and it (as with any logging) will decrease performance slightly.
Walkthrough
Navigate to your app files using the Kudu console:
- Open your Azure portal and navigate to your Azure Web App (under App Services) that is hosting the Web Job
- Open the Kudu link and click the 'go' link:

- Select 'Debug console' then 'CMD'

- Navigate to the jobs folder by clicking on the folders: home,site,wwwroot,app_data,jobs or… simply type in the console: cd\home\site\wwwroot\app_data\jobs

Your job might be a triggered or continuous job so next you need to navigate to that directory by clicking on the appropriate folder (my example is a triggered job) and then locating the folder for your job. Then find the executable and config file for your app (hint: if there is not a config file, simply create one with the touch command in the console: touch NAMEOFYOUREXE.exe.config). In my case the name of the executable is WebJobToProfile.exe and the config file is WebJobToProfile.exe.config:

Now edit the .config file by clicking on the pencil icon. Then add the following to the top of the <configuration> section and hit save:
<system.diagnostics>
<trace autoflush="true" />
<sources>
<source name="System.Net">
<listeners>
<add name="System.Net"/>
</listeners>
</source>
<source name="System.Net.HttpListener">
<listeners>
<add name="System.Net"/>
</listeners>
</source>
<source name="System.Net.Sockets">
<listeners>
<add name="System.Net"/>
</listeners>
</source>
<source name="System.Net.Cache">
<listeners>
<add name="System.Net"/>
</listeners>
</source>
</sources>
<sharedListeners>
<add
name="System.Net"
type="System.Diagnostics.TextWriterTraceListener"
initializeData="d:\home\logfiles\System.Net.trace.log"
traceOutputOptions = "ProcessId, DateTime"
/>
</sharedListeners>
<switches>
<add name="System.Net" value="Verbose" />
<add name="System.Net.Sockets" value="Verbose" />
<add name="System.Net.Cache" value="Verbose" />
<add name="System.Net.HttpListener" value="Verbose" />
</switches>
</system.diagnostics>

Note:
This highlighted section is where the log will be written: initializeData="d:\home\logfiles\System.Net.trace.log" . If you do not use my sample from above you should ensure you include this section which gives process and date information in the log: traceOutputOptions = "ProcessId, DateTime"
Now run your web job (If this is a continuous web job, you need to stop and start it because configuration files are read when the .exe first loads) and when your code makes a System.Net trace, it will write the log file. After you are done tracing, remove your changes so you are not logging any more!
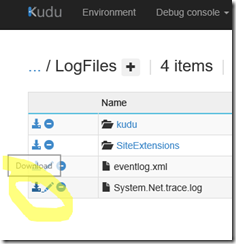
You can now download the system.net.trace.log file.
Click on the Home icon, navigate to the LogFiles directory by clicking on the LogFiles folder and click on the Download icon to download the log!

Conclusion
The system.net trace is a powerful tool to see what your .Net app is doing at the socket level. Try it out to see if it helps resolve your issues or to simply see what is happening with your WebJob! DO NOT FORGET to back out your logging changes when done by removing the <system.diagnostics> settings you added to enable logging!
Drop me a note if you found this useful!
You must be a registered user to add a comment. If you've already registered, sign in. Otherwise, register and sign in.