- Home
- Windows Server
- Ask The Performance Team
- MYSTERY MEMORY LEAK: WHERE DID MY MEMORY GO?!
- Subscribe to RSS Feed
- Mark as New
- Mark as Read
- Bookmark
- Subscribe
- Printer Friendly Page
- Report Inappropriate Content
Hello,
My name is Jeffrey Worline, and I am a Senior Support Escalation Engineer on the Windows Performance Team at Microsoft. This blog addresses how to troubleshoot unaccounted memory usage or leak to include identifying and data collection.
If you already determined the process consuming memory, check out my previous blog post: Memory Leaks in a Process
Scenario
- When you cannot reconcile the amount of RAM being used with task manager, resource monitor, or perfmon collection.
- Large chunk of RAM being used but you cannot see where or by what.
Troubleshooting
Scenario A
When large amount of RAM is being used by not accounted for in task manager or resource manager. How do we find or account where that mystery memory is being used? RAMMap from Sysinternals is the tool needed for the job.
- First, when looking in task manager and at the memory usage by processes to view memory usage, ensure you also look in the Memory box on the performance tab – the amount of cached, paged pool, and non-paged pool memory usage.
- Download RAMMap
- Launch RAMMap to have it take a snapshot of memory usage.
Glossary and Guide to the column and row headings
Stages of memory
- Active: Pages of physical RAM in active use by the specified category (usually a process working set or the system working set).
- Standby: Pages of physical RAM not actively being used. These are still left in physical RAM but will be repurposed first by the memory manager (either returned to the active list or zeroed out and reused) if something needs physical ram for active pages.
- Modified: Similar to Standby, but these are pages of physical RAM that have been changed and must be flushed to disk before reusing them.
- Modified no write: Similar to modified pages but have been marked not to write out to disk.
- Transition: Pages that are in transition between any of the other categories
- Zeroed: Pages that have been zeroed out and are ready to be used – they can be quickly allocated for new physical memory allocations
- Free: Free pages are free to be used but have some type of “dirty” data in them so they must be zeroed for security reasons before given to a user process. These are usually pages that have been freed by an existing process.
- Bad: These are physical pages that have been marked as bad.
Areas of interest would be the following rows to check for high memory consumption to account where the rest of your memory is being used.
TIP:
If you have a memory leak and get to the point of almost running out of memory, the normal procedure is to reboot the machine in order to clear out the memory. You can use RAMMap to clear areas of memory negating the need to reboot the machine.
Types of memory usage
- Process Private: Memory allocated for use only by a single process.
- Mapped file: Mapped “views” of files are when the contents of that file are mapped to virtual addresses in memory.
- Shareable: Pages that have been marked as shared can be used by multiple processes.
- Paged Pool: Kernel pooled memory that can be paged to disk.
- Nonpaged Pool: Kernel pooled memory that cannot be paged to disk.
- Session Private: Memory that is private to a particular logged in session. This will be higher on RDS Session Host server.
- Metafile: Metafile is a part of the system cache containing NTFS metadata and used to increase the performance of the file system.
- AWE: You will typically see this used by SQL or other database applications.
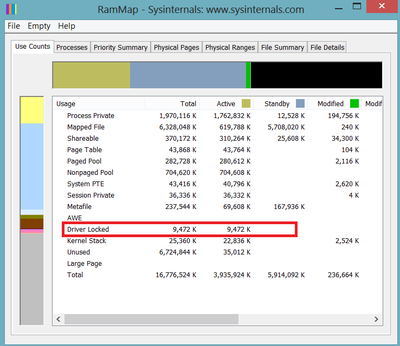
- Driver Locked: These are pages that have been locked in physical RAM by a driver. Usually see this usage with Hyper-V or VMware virtual machines.
- Large Page: Normal page size for Windows memory is 4kb on x64 systems. But with large pages, the size is 2mb. SQL Server and Oracle support the concept of Large Pages when allocating memory.
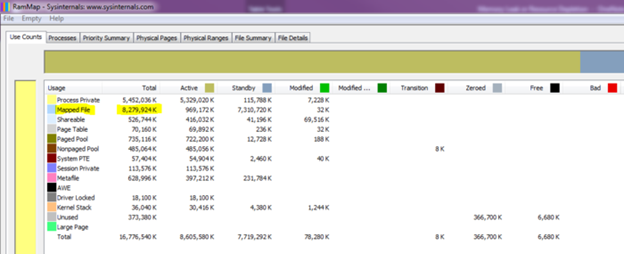
In this snapshot, you can see that about half of the physical RAM being used is by Mapped Files:
- In this example, next we would click on the Physical Pages tab
- Now at the bottom of the tool select "Use" for the Filter and "is" select "Mapped File" from the drop down.
This will now show you all the mapped file entries.
- Next, I would click on the File Name column heading to group similar file names so at this point I could look to see if all the mapping were going to the same path or general path to help determine what is causing all the mapped files.
This information is not something you will see any place else other than an RAMMap or memory dump.
Scenario B
On a VMWare or Hyper-V system, the hypervisor can take memory away from one VM and give it to another VM. It does this by using a driver loaded in the VM to "lock" the memory at the kernel level which can then be given to another VM. If too much memory is taken away, this will cause working set trimming and general performance issues. Standard perfmon memory counters will not provide the info to account for the missing memory. This driver locked or "ballooned" memory can be seen 4 different ways depending on the OS.
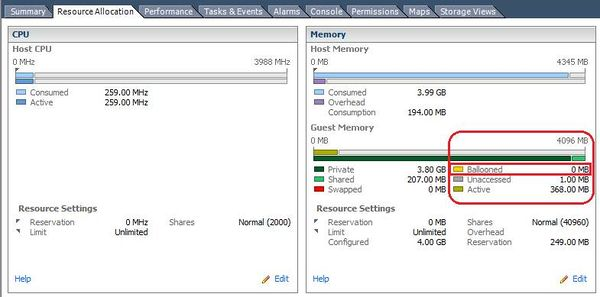
VMWare console - Memory and processor utilization for each VM will be clearly seen in the VMWare console. If you have access to the console, then this is the preferred method to see the state of memory in the VM.
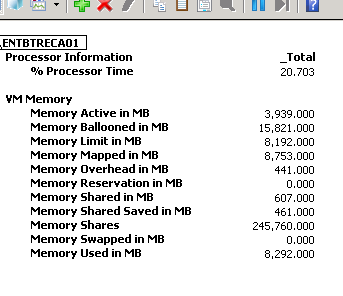
VMware performance counters - When VMWare tools are installed, VMware performance counters are also created. These can be manually loaded in Performance Monitor or use the logman.exe method below to set up perfmon collection.
Example of Logman to collect VMWare processor and memory counter:
The following will configure the counters, set logging to circular with max file size of 300 mb, and take a counter reading every 3 seconds.
- The resultant log will be place in c:\perflogs.
<<Start Search>>, enter "CMD.exe" w/o the quotation marks and then press Enter.
- Copy and paste the following command into the command prompt window:
Logman.exe create counter PerfLog-Short -o "c:\perflogs\PerfLog-Short.blg" -f bincirc -v mmddhhmm -max 300 -c "\LogicalDisk(*)\*" "\Memory\*" "\Cache\*" "\Network Interface(*)\*" "\Paging File(*)\*" "\PhysicalDisk(*)\*" "\Processor(*)\*" "\Processor Information(*)\*" "\Process(*)\*" "\Thread(*)\*" "\Redirector\*" "\Server\*" "\System\*" "\Server Work Queues(*)\*" "\Terminal Services\*" "\VM Processor\*" "\VM Memory\*" -si 00:00:03
- Start the log with:
Logman.exe start PerfLog-Short
- To stop perfmon log:
Logman.exe stop PerfLog-Short
Example output from Perfmon:
Example Sysinternals RAMMap:
- Jeffrey Worline
You must be a registered user to add a comment. If you've already registered, sign in. Otherwise, register and sign in.


