- Home
- Windows Server
- Virtualization
- Monitoring Hyper-V Replica using System Center Operations Manager
- Subscribe to RSS Feed
- Mark as New
- Mark as Read
- Bookmark
- Subscribe
- Printer Friendly Page
- Report Inappropriate Content
Customers asked us if they can have a monitoring mechanism for Hyper-v Replica in a rainy day scenario. With System Center Operations Manager 2012 SP1, customers can now monitor Hyper-V Replica using a Management Pack available for free from the catalogue of SCOM. This blog post will deal with adding the management packs to SCOM setup to monitor Hyper-V Replica . If you haven’t completed your setup , return to this blog after setting up SCOM and installing agents.[ You can refer to Installing Operations Manager On a Single Server , Deploying SCOM for installation and Managing Agents for discovering and installing agents]
Before we start monitoring Hyper-v Replica, we need to import necessary management packs into SCOM. SCOM catalogue provides a management pack named “Microsoft Windows Hyper-V 2012 Monitoring” to monitor the state changes of Hyper-v Replica.
Import Management Pack
To import this management pack,
1. Go to “Authoring Workspace” and click on “ Import management packs ”. Thi...

2. Click on “ Add ” and from the drop down select “ Add from Catalog … ”. This will open Catalog Menu.
3. In the Find field, type “ Hyper-V 2012 Monitoring ” and click Search .

4. Select “ Microsoft Windows Hyper-V 2012 Monitoring ” and Click “ Add ” and then Click “ OK ”.
5. If you come across a screen like below, it means that required dependent management packs are not imported. Click on “ Resolve ”.

6. In the Dependency Warning that pops up, Click Resolve . This action will list all the dependent management packs that needs to be imported. Click Install .
7. Once all packs are imported, click on Close .
You can cross verify the importing of management pack by going to Monitoring workspace and looking for “ Microsoft Windows Server Hyper-V ”:

To get a list of Available monitors click on, Tools->Search->Monitors and in the search field type “ Replica ”. This will list all 9 monitors provided by Management pack.
The supported Monitors and the situations in which they will get triggered is summarized in the following table:
|
Monitor |
Root cause |
|
Hyper-V 2012 Replica Windows Firewall Rule Monitor |
The Windows Firewall rule to allow replication traffic to the Replica site has not been enabled. |
|
Hyper-V 2012 Replication Critical Suspended state monitor. |
Network bandwidth is not sufficient to send the accumulated changes from the primary server to the replica server Storage subsystem on either the primary or replica site is not properly provisioned from space and IOPS perspective. The replication is paused on either primary or replica VM |
|
Hyper-V 2012 Replication Reverse Replication not initiated. |
Failover has been initiated but reverse replication to primary is not initiated. Replication is not enabled for failed over VM. |
|
Hyper-V 2012 Replication not started monitor. |
Initial replication has not been completed after setting up a replication relationship. |
|
Hyper-V 2012 Replica out of sync. |
Lack of network connectivity between the primary and replica servers.
Network bandwidth is not sufficient to send the accumulated changes from the primary server to the replica server. Storage subsystem on either the primary or replica site is not properly provisioned from space and IOPS perspective. The replication between on the primary or replica VM might be paused. |
|
Hyper-V 2012 Node's Replication broker configuration monitor. |
Cluster service stopped unexpectedly Hyper-V Replica Broker is unable to come up on the destination node after a cluster migration. |
|
Hyper-V 2012 Replica Network Listener |
Conflict on the network port configured for Replica or SPN Registration might have failed(Kerberos) Certificate provided is either invalid or doesn’t meet pre-requisites(HTTPS) |
|
Hyper-V 2012 Replication Resync Required state monitor. |
VM went into Resync required mode. |
|
Hyper-V 2012 Replication Count Percent Monitor |
The replicating virtual machine has missed more than the configured percentage of replication cycles |
Viewing the properties of the monitor:
To view the properties of the monitor, you can select the monitor (you can select results from Search and Click “ View->Monitors ”) and right click on the monitor and Click on “ Properties ”.
General Properties: Defines Name; Gives a description of Monitor and mentions the target. It also mentions which parent monitor it belongs to. (More on Monitors, here )
Health: Mentions the conditions which trigger the monitor health state change.
Alerting: Settings related to Generation of Alerts are displayed here.
Diagnostic and Recovery: User can create a diagnostic task and configure whether to run automatically or trigger manually once an alert is generated. User can also create a recovery task either in VB Script or in J Script or can create a PowerShell commandlet recovery task.
Configuration: Mentions important parameters of Monitor’s default properties.
Product Knowledge: This tab provides with Summary of what monitor tries to achieve, causes of state change and handful resolutions to return to Healthy State.

Changing the properties of the Monitor:
You can control the way alerts are being generated and their triggering properties. To change the properties of a monitor, go to Monitor (you can select results from Search and Click “ View->Monitors ”) and click “ Overrides->Override the Monitor ” and select the appropriate objects for which you want to change the properties of the monitor.

After you have selected override option, you will be presented with following UI. Select the property you want to change and check the “ Override ” checkbox and change the properties. You can select Management pack in which you want to put up the updated monitor.

Diagnostic and Recovery Task:
You can add a diagnostic and Recovery task for a monitor through Monitor properties UI as discussed above. To Create a Diagnostic or Recovery task, Click on “ Add->Diagnostic for Critical Health State ” from “ Configure Diagnostic Tasks ” section under Diagnostic and Recovery tab. You can either run a command or a script as a diagnostic task. You can select health state for which this will get executed and have the option of executing this command or script automatically once the monitor state has changed. You can also edit or remove previously added tasks.
To trigger a diagnostic or recovery task manually for an alert follow these steps:
1. Select the alert in Monitoring workspace and Click on Health Explorer .
2. In health explorer, select the Monitor and on the right hand side, Click on “ State Changes ” tab.
3. Diagnostic tasks are listed immediately after Context while Recovery Tasks can be found at the bottom of the page.


Management Pack from Codeplex:
One of our field engineers, Cristian Edwards Sabathe, has developed a Management pack which displays the state of the replication in a dashboard. Download the pack from here .
Once you have downloaded the pack, to import pack into SCOM follow these steps:
1. Go to authoring workspace and click on Import Management Pack.
2. Click on “ Add ” and select add from disk option.
3. Give path of MPs to the folder to which you have downloaded packs from above link.
4. If there are dependent management packs missing, it will report it in UI. Click on “ Resolve ” to import all dependency packs.
Hyper-V Replica DashBoard:
Hyper-V Replica dashboard will be present in Monitoring view. It is part of “ Hyper-V MP Extension 2012-> Hyper V Replica ” folder. Dashboard will display the source of the virtual machine and its health state using icons.

Primary VMs/Recovery VMs view will show the primary VMs, their health state, replication state and replication health(1-normal;2-warning;3-critical), primary and recovery servers for the VM, mode of replication along with many other useful fields which can be customized using “ Personalize view ” option.

Notification of alerts
Alerts are generated whenever a state change occurs, Great!! But do I have to look through the SCOM screen 24x7 to see if an alert is generated? Fortunately, the answer is NO . SCOM provides a subscription mechanism through which user gets the alert via an email or an SMS or an IM or can raise a ticket.
1. To create a subscription, select any alert and select “ Subscription->Create ” in the right hand side of the UI in Authoring workspace. This will open up Notification Subscription wizard.

2. In the wizard, specify a Name and Description to Subscription and click Next .
3. In the Conditions box, check “created by specific rules or monitors”. In the criteria description box, click on the already existing monitor to bring up “ Monitor and Rule Search ” form.
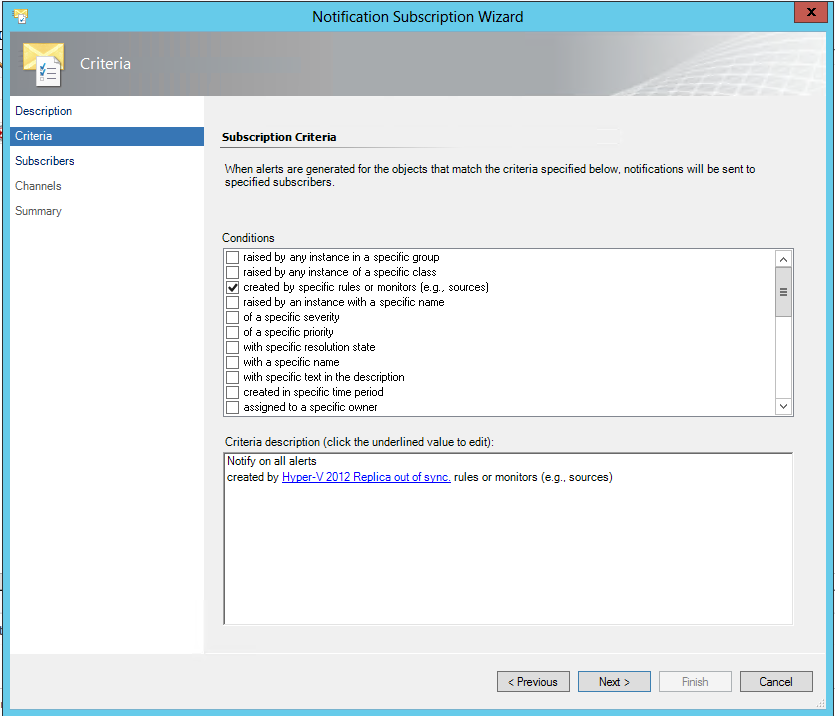
4. In the Monitor and Rule search form, type “ Replica ” in Filter By field and click on “ Search ”. This will list down all 9 monitors in available rules and monitors. Select the monitors for whose alerts you want to receive a notification and add them by clicking on “ Add ” button. Once you have added all the desired monitors to receive notifications, click on “ OK ”.

5. Click “ Next ” In notification Subscription wizard. Complete the wizard as per the subscription requirements. You can refer to How to Create Notification Subscribers and Subscribing to Alert Notifications on how to complete the wizard.
In Summary Management packs from Catalogue and CodePlex provide a great way to monitor the Hyper-V Replica through System Center Operations manager and will integrate with it seamlessly.
You must be a registered user to add a comment. If you've already registered, sign in. Otherwise, register and sign in.