Turn on suggestions
Auto-suggest helps you quickly narrow down your search results by suggesting possible matches as you type.
- Home
- System Center
- System Center Blog
- New SCOM Web Console – Blog series (Post 5/5): Sample Custom Dashboard walkthrough
New SCOM Web Console – Blog series (Post 5/5): Sample Custom Dashboard walkthrough
- Subscribe to RSS Feed
- Mark as New
- Mark as Read
- Bookmark
- Subscribe
- Printer Friendly Page
- Report Inappropriate Content
Published
Feb 16 2019 04:40 AM
6,673
Views
Feb 16 2019
04:40 AM
Feb 16 2019
04:40 AM
First published on TECHNET on Feb 12, 2018
SCOM 1801 marks the release of REST APIs for SCOM SDK. Using these APIs a user can create any custom client application of their own. This blog aims at walking the user through a scenario where a complete standalone application is developed and deployed using the SCOM REST APIs. This application can even be brought inside the Web Console using Custom Widget and can be made to reside next to any of the widgets shipped by SCOM.
It is highly recommended to go through the other previous blogs in the series to better understand the content provided here.
The sample is a JavaScript based application that is communicating with SCOM SDK and displaying data to the user who can take further action on the same. We have also tried to stretch the limit of custom widget here by not only limiting it to be used as a widget but rather as a standalone application in itself. This application could then be rendered as a dashboard or a widget, we leave the choice to you. The sample comprises of two major sections:
This is a view designed to give a quick overview about the current monitoring state. It can act as a starting page using which you can proceed with further actions. Below is a screenshot of how the Overview Dashboard looks like:
As displayed in the image above the Overview Dashboard has two major sections:
This section shows the active alerts for the past 7 days in three categories namely critical, warning and informational alerts. If you are interested, you may dive into the individual alerts by clicking “View Details”. For example if you click on “View Details” under critical alerts, you’d see a view like:

Need more information? You got it!
Each of these rows are clickable and would take you to our very own drilldown pages (refer to blog 4/5 for more details on drilldown).
Once an alert above is clicked, it launches the following drilldown page:

As you can see, there is a lot more detail about the alert here which would help you in further investigating the issue.
For a given target class and given target object group you’d see the health states in three buckets namely unhealthy, in maintenance mode and healthy. The target class and target group field can be modified and the health state information displayed below would modify as per the new input. By default this view shows health state information about the “Windows Computer” SCOM class.
Similar to alert you can see the details of the entity by clicking “View Details”:

And yes, you guessed it right. We have drilldown pages for these entities as well! Here’s how they look like:

There is a bunch of information about the entity here like related objects (their health states and properties), the alerts targeted to this entity, performance metrics and the classes this entity belongs to. Most of the entries shown above can be drilled down further giving a more detailed view. Again, going over all the details is out of scope for this blog and we’d strongly recommend going over through the detailed documentation .
Know what you are looking for but hate to go over multiple pages and views in the current desktop or web console? Then this search section is designed just for you!
Here you can search for any active alert (for the last 7 days), SCOM object, SCOM group, SCOM class, rule or any monitor. The search is asynchronous and quite fast. It’d help you choose the starting point using which you can further drilldown. Below is a screenshot of how search looks like (say you search for the term “health”):

And that’s not it! Remember drilldown? From all of these search results you can jump to their drilldown pages and proceed with any action you may wish!
Below are a couple of screenshots portraying what you can expect after clicking these results (you have already seen the alert and object drilldown pages above when we were at Overview Dashboard):


Well this is just the beginning! The intention of walking you over this sample application was to show you the power custom widget and in turn, the SCOM REST APIs provide. With a few lines of code, one can achieve functionality which would otherwise have taken a lot more steps.
Feel free to go through the SCOM REST API documentation and create your own user stories and your own custom widgets!
There are multiple ways you can deploy the sample dashboard discussed in this blog:
Note: From now on we will refer to the content available in attached zip file: Custom-Widget
A management pack containing the two individual sections (overview and search) are available under " Custom Widget\Management Pack\"
Import this management pack and you should see two dashboards overview and search having the two sections respectively.
Discussing the technical approach of how the sample widget presented here works is out of scope of this blog. The code has been documented thoroughly and documentation has been generated using JSDoc. The documentation can be found under " Custom Widget\Source Code\docs\"
Start with index.html and that would guide you through all the code.
Refer to " Custom Widget\Source Code\dist\js\helpers\data-helper.js " for an example of how SCOM REST APIs can be used.
For more details on SCOM REST APIs, please refer https://docs.microsoft.com/en-gb/rest/operationsmanager/
For the sample app discussed above, the following 3 rd part libraries were used:
About
SCOM 1801 marks the release of REST APIs for SCOM SDK. Using these APIs a user can create any custom client application of their own. This blog aims at walking the user through a scenario where a complete standalone application is developed and deployed using the SCOM REST APIs. This application can even be brought inside the Web Console using Custom Widget and can be made to reside next to any of the widgets shipped by SCOM.
It is highly recommended to go through the other previous blogs in the series to better understand the content provided here.
What does the sample comprise of?
The sample is a JavaScript based application that is communicating with SCOM SDK and displaying data to the user who can take further action on the same. We have also tried to stretch the limit of custom widget here by not only limiting it to be used as a widget but rather as a standalone application in itself. This application could then be rendered as a dashboard or a widget, we leave the choice to you. The sample comprises of two major sections:
- Overview Dashboard
- Search Dashboard
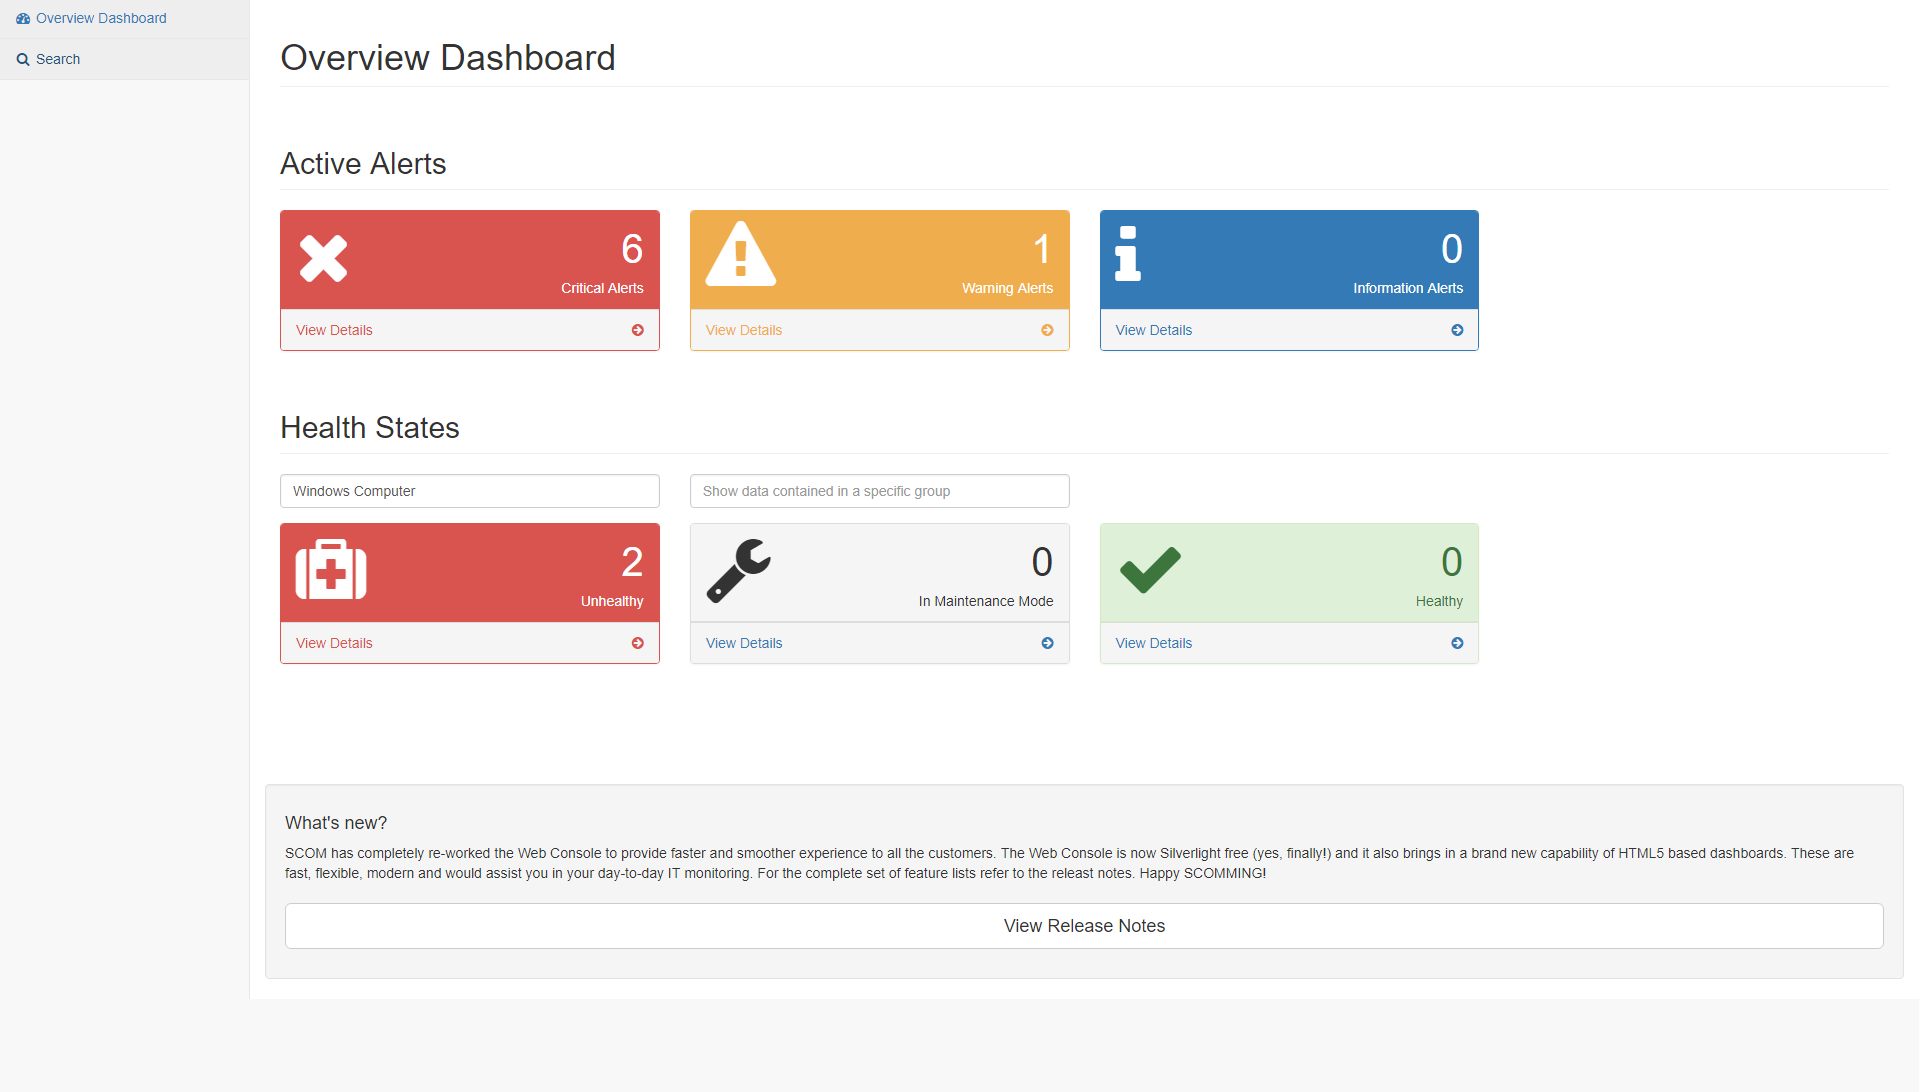
Overview Dashboard
This is a view designed to give a quick overview about the current monitoring state. It can act as a starting page using which you can proceed with further actions. Below is a screenshot of how the Overview Dashboard looks like:
As displayed in the image above the Overview Dashboard has two major sections:
- Active Alerts
- Health States
Active Alerts
This section shows the active alerts for the past 7 days in three categories namely critical, warning and informational alerts. If you are interested, you may dive into the individual alerts by clicking “View Details”. For example if you click on “View Details” under critical alerts, you’d see a view like:
Need more information? You got it!
Each of these rows are clickable and would take you to our very own drilldown pages (refer to blog 4/5 for more details on drilldown).
Once an alert above is clicked, it launches the following drilldown page:
As you can see, there is a lot more detail about the alert here which would help you in further investigating the issue.
Health States
For a given target class and given target object group you’d see the health states in three buckets namely unhealthy, in maintenance mode and healthy. The target class and target group field can be modified and the health state information displayed below would modify as per the new input. By default this view shows health state information about the “Windows Computer” SCOM class.
Similar to alert you can see the details of the entity by clicking “View Details”:
And yes, you guessed it right. We have drilldown pages for these entities as well! Here’s how they look like:
There is a bunch of information about the entity here like related objects (their health states and properties), the alerts targeted to this entity, performance metrics and the classes this entity belongs to. Most of the entries shown above can be drilled down further giving a more detailed view. Again, going over all the details is out of scope for this blog and we’d strongly recommend going over through the detailed documentation .
Search Dashboard
Know what you are looking for but hate to go over multiple pages and views in the current desktop or web console? Then this search section is designed just for you!
Here you can search for any active alert (for the last 7 days), SCOM object, SCOM group, SCOM class, rule or any monitor. The search is asynchronous and quite fast. It’d help you choose the starting point using which you can further drilldown. Below is a screenshot of how search looks like (say you search for the term “health”):
And that’s not it! Remember drilldown? From all of these search results you can jump to their drilldown pages and proceed with any action you may wish!
Below are a couple of screenshots portraying what you can expect after clicking these results (you have already seen the alert and object drilldown pages above when we were at Overview Dashboard):
Clicking a rule:
Clicking a monitor:
Well this is just the beginning! The intention of walking you over this sample application was to show you the power custom widget and in turn, the SCOM REST APIs provide. With a few lines of code, one can achieve functionality which would otherwise have taken a lot more steps.
Feel free to go through the SCOM REST API documentation and create your own user stories and your own custom widgets!
Deployment
There are multiple ways you can deploy the sample dashboard discussed in this blog:
- Importing the management pack
- Adding it alongside SCOM Web Console as a JavaScript application (with this the application will have its own URL and may or may not be added as a custom widget)
- Adding the two sections as individual widgets
Note: From now on we will refer to the content available in attached zip file: Custom-Widget
Importing the management pack
A management pack containing the two individual sections (overview and search) are available under " Custom Widget\Management Pack\"
Import this management pack and you should see two dashboards overview and search having the two sections respectively.
Adding it alongside SCOM Web Console as a JavaScript application
- Go to the directory where SCOM 1801 Web Console is installed. Ex. C:\Program Files\Microsoft System Center\Operations Manager\WebConsole\Dashboard\
- Create a folder named “custom”. Note that you may choose any folder name, this is just an example
- Copy the contents placed under " Custom Widget\Source Code\ "
- Go to SCOM Web Console
- Create a dashboard
- Click Add Widget and select Custom Widget from the dropdown.
-
When asked for source code enter the following:
<iframe src="http://your_server_name/OperationsManager/custom " style="width: 100%; height: 100%"></iframe>
Here replace your_server_name with your Web Server - Hit save and you are done!
Adding the two sections as individual widgets
- Go to SCOM Web Console
- Create a dashboard
- Click Add Widget and select Custom Widget from the dropdown.
- When asked for source code pick the contents of any one file from under " Custom Widget\Individual Sections\ "
- Hit save
- Repeat 4 and 5 for the other one or repeat 2-5 if you wish to add these in separate dashboards
Documentation
Discussing the technical approach of how the sample widget presented here works is out of scope of this blog. The code has been documented thoroughly and documentation has been generated using JSDoc. The documentation can be found under " Custom Widget\Source Code\docs\"
Start with index.html and that would guide you through all the code.
How SCOM REST APIs can be used
Refer to " Custom Widget\Source Code\dist\js\helpers\data-helper.js " for an example of how SCOM REST APIs can be used.
For more details on SCOM REST APIs, please refer https://docs.microsoft.com/en-gb/rest/operationsmanager/
References
For the sample app discussed above, the following 3 rd part libraries were used:
- jQuery : <script src="https://cdnjs.cloudflare.com/ajax/libs/jquery/3.2.1/jquery.min.js"></script>
- jQuery UI : <script src="https://code.jquery.com/ui/1.12.1/jquery-ui.js"></script>
- MetisMenu: <script src="https://cdnjs.cloudflare.com/ajax/libs/metisMenu/2.7.1/metisMenu.min.js"></script>
- Bootstrap : <script src="https://cdnjs.cloudflare.com/ajax/libs/twitter-bootstrap/3.3.7/js/bootstrap.min.js"></script>
- jQuery DataTables : <script src="https://cdn.datatables.net/1.10.16/js/jquery.dataTables.min.js"></script>
- Bootstrap DataTables : <script src="https://cdn.datatables.net/1.10.16/js/dataTables.bootstrap.min.js"></script>
- Responsive DataTables : <script src="https://cdn.datatables.net/responsive/2.2.0/js/dataTables.responsive.min.js"></script>
0
Likes
4 Comments
You must be a registered user to add a comment. If you've already registered, sign in. Otherwise, register and sign in.