- Home
- Security, Compliance, and Identity
- Core Infrastructure and Security Blog
- Three Cheers for the Authoring Resource Kit Tools! Part II – The Workflow Simulator
- Subscribe to RSS Feed
- Mark as New
- Mark as Read
- Bookmark
- Subscribe
- Printer Friendly Page
- Report Inappropriate Content
First published on MSDN on Jan 02, 2010
You’ve just built out several custom rules/monitors/discoveries – it’s late, you think you are almost done – just a bit of testing to go and….they don’t work. You look them over again and don’t see anything wrong – wouldn’t it be really cool if there was a way to see the ‘internals’ that are happening when the workflow runs? Introducing – the workflow simulator which is part of the Authoring Resource Kit Tools available here .
Remember in MOM 2005 days when we had the ability to configure script tracing to actually watch the execution of a script running on an agent? You could also cause the script to open in a debugger to walk through execution line by line. The only caveat is that you had to have the script running through the agent. The workflow simulator will do all of the stuff MOM 2005 did and more. Essentially, any workflow that you have configured can be executed in the simulator without any need to have the workflow actually deployed to the agent. One requirement – you do have to have the agent installed on the system where you will be using the simulator so that the required binaries are present.
So where is this simulator and how is it used? Once you have the authoring console resource kit tools installed the simulator is available in the authoring console itself. We will take a look at the simulator and walk through using it with three sample discoveries that in a custom BackITupNOW! management pack that I created when authoring the targeting chapter in the upcoming OpsMgr R2 Unleashed ebook. We will start with a simple registry discovery and use that to also talk about the configuration of the simulator and then move on to a WMI discovery and finally a simple script based discovery. For each example I will show a working discovery and then show the results with the same discovery that doesn’t return data.
Workflow Simulator
We start by opening the BackITupNOW! management pack in the authoring console and then navigating to the discoveries node and our three sample discoveries as shown.

OK, so where is the simulator! It’s a bit hidden but if you simply right-click on any of the three discoveries you will note the simulate option in the displayed menu. If an authoring console element doesn’t support simulation then the option will appear grey.

Selecting ‘Simulate’ launches the simulator tied to the specific workflow from which the simulator was launched – as shown.

I’ve expanded several sections of the simulator to show the various configuration options. Let’s walk through the specific sections. The first section displays the name of the workflow and it’s target – no configuration to be done here – the fields won’t allow editing.

Next, the Target Expressions options. There are a couple of settings we can tap into here. First, note whether there is a green check mark or a yellow exclamation mark here. If the yellow exclamation is seen that means some of the variables/values required by the workflow cannot be resolved and either need to be configured manually or, if the workflow in question has been imported to your management group, you can select to connect to the RMS and resolve the values.

I resolved my expressions from my RMS. Doing so presents the dialog below allowing connection information to be specified.

If no RMS is available to auto-resolve the variables then it’s easy enough to resolve them manually, either by typing in a value or allowing the simulator to auto-generate a GUID for fields that require them. Remember that this is a simulation – the results are accurate but the data doesn’t have to be accurate (such as with a GUID) – it just needs to be in the correct format and enough to allow required workflow have values that will work.

The next field is the override values. The options here will vary depending on the workflow but for the simulation you might consider changing values such as frequency, etc. to allow the workflow to run more quickly or have a different timeout, etc.

With all of the above configured you are almost ready to start the simulation. First though you need to decide whether to resolve any $MPElement/…$ expressions (I always leave this option selected) and whether to debug scripts. The debug script option only works when running a workflow that contains a script and will also only work if you have a script debugger registered. A good simple script debugger is the Microsoft Script Debugger – you can download it here and I will show it in action when we get to our script based discovery example.
With these options configured, start the simulation. Once you get the simulation started and the first elements of the simulation appear we have a few additional options we can configure. If you right-click on a module you will see additional options. I tend to choose to enable tracing for the whole workflow which will launch the workflow analyzer when the simulation is running so you can see even more detail (I discuss the workflow analyzer in part I of this series – available here ). You will also note that XML output is available for review from each of the running modules. By reviewing the XML output of the simulator and the workflow analyzer together you can generally put together whether the workflow is running as expected or not and the reasons why.

Registry Discovery - Good
As mentioned earlier, i will show both a good and a bad simulation for each of my three discovery workflows. Let’s look at the good simulation for my registry discovery. First, let’s take a look at the configuration of the registry discovery. As shown below, we are looking for 4 registry values – Device, GroupName, InstallDate and InstallDirectory. We are specifically trying to find systems that have the following values for these entries
Device – Tape
GroupName – Group
InstallDate – 09
Installdirectory – c:\backITupNOW
If the discovery doesn’t find these values it will not return a match.


Running this workflow through the simulator we get the output below. the first module, the schedule doesn’t tell us much except which healthserviceid we are operating against and the time when the schedule fired – which cold be useful if trying to diagnose a workflow that is not operating on time.

The probe module shows the attempt to read the registry and the values it found. This module maps to the registry probe configuration settings configured on the discovery.

The same XML data is seen for the filter module but here we are evaluating to ensure we have a match – this section maps to the expression settings configured on the discovery.

Finally, the mapper module pulls it all together and takes the discovered data, which passed our filter, and submits it as discovery data. The screens below show the total XML and are modified a bit to get as much of the XML in the display as possible.


So the simulator has given us a great deal of good information. Now add the data from the workflow analyzer and the detail is even richer. I won’t add much since the data speaks for itself but note that for each registry value we can see what is determined to be a match.


Registry Discovery - Bad
So that was a working discovery – now lets change just a single value in the registry to other than what is expected and see the difference. Notice I just changed the install dir from c:\ to d:\

Run the simulator again – notice the probe information is the same but the filter does not generate any data since we don’t have a match and there is no discovery data returned in the mapper.


And from the workflow analyzer we can see the mismatch and all subsequent attempts to match stop.

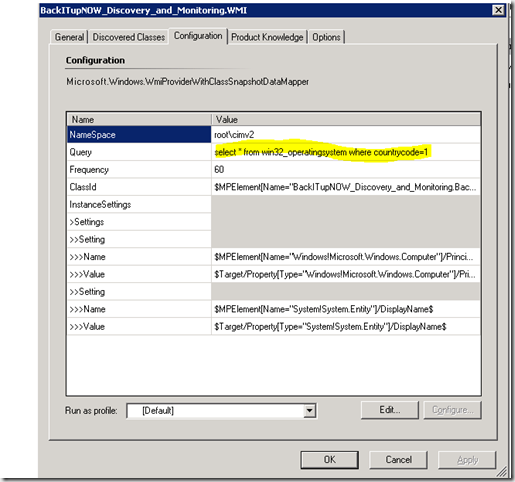
WMI Discovery – Good
We’ve seen the registry discovery – what about a WMI discovery. Here is the detail of what happens in the simulator and workflow analyzer.
The discovery will only match if the countrycode value is equal to 1. This likely is not a value you would use in a real discovery but it allows an easy demonstration of a good vs. bad WMI discovery.
In the analyzer we only have three modules that return data – the first is our scheduler module.

The probe module actually reads the WMI class and shows all of the associated data. Note that country code does equal 1.


The mapper module shows the discovery data being submitted.
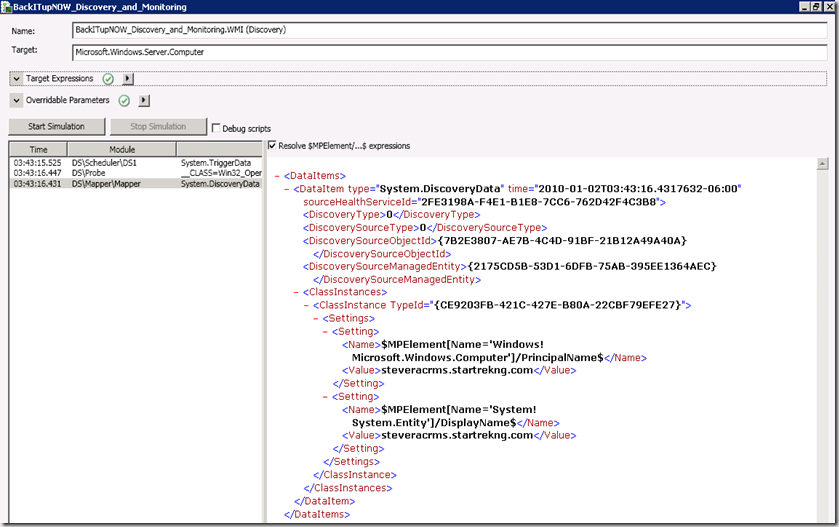
The same results in the workflow analyzer are not as detailed as for the registry discovery but one key item we can see is that one data item is listed as returned as part of the workflow. That means discovery was successful and data was submitted.

WMI Discovery – Bad
Now that we’ve seen a sample of a good WMI discovery let’s run one that won’t return discovery data. To do that I simply change the country code to a value of 2 so I will get no match.

I still have the same three modules that display but note for the probe that I have no data returned and for the mapper I return no class instance for my discovery.


I also see in my analyzer that there are no data items returned meaning the discovery was not successful. Actually, a word on that for a minute. In the registry example and in this example – and in the next example, I refer to discoveries not being successful. Thats not really true – the discovery is always successful meaning that it does run and look to see if the system matches the discovery criteria – if it does we return a data item and if it doesn’t we return nothing. So the discovery does, in fact, work – but just returns no data. Just wanted to clear up that potential confusion.

Script Discovery – Good
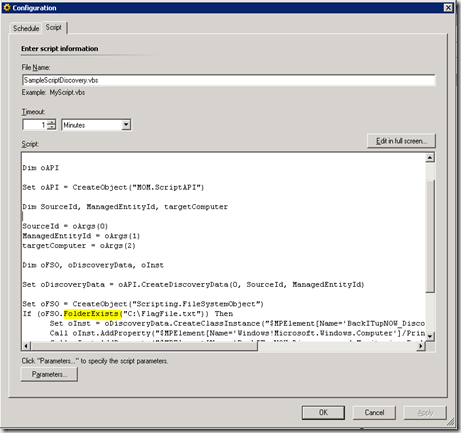
We’ve seen registry and WMI discoveries – now let’s look at a script discovery. Notice the yellow highlight in the script. When the script runs it will specifically look for a FOLDER called flagfile.txt. if it doesn’t find a folder by this name, the script simply exits.
Running this through the analyzer we see two modules – our familiar scheduler module and the script module. You can see in the XML for the script module that the script does run and does return data meaning the discovery was successful.


Looking in the analyzer we can get even more useful information – such as the command line used for the script, the XML blog containing discovery information that is submitted, etc.

Script Discovery – Bad (with script debug enabled)
To give an example of a discovery that doesn’t submit data, I simply delete the flagfile.txt folder and rerun the simulation. Note that this time I selected the option to debug the script. This is very useful if you are seeing problems with the script where you expect data to be returned but it isn’t, etc. In the simulator I see my scheduler module but there is no script module – since nothing is returned from the script no data is submitted.

My script does attempt to run because my debugger pops up. I trace the script execution to the highlighted line and then the script simply exits. Why? Because there is no folder named flagfile.txt.

Looking at the analyzer I see that a script error is encountered showing data loss but no message is displayed. This may be misleading since no error really occurred – my script simply exited because a condition wasn’t met.

And there you have it – a brief walk through of the workflow simulator. I find this to be an immensely useful tool. In the examples we used discoveries from a custom and unsealed management pack – but the simulator works just fine with workflows from sealed management packs too. Note also that there are some limitations to the simulator so be sure to check out the help file documentation and review them.
You must be a registered user to add a comment. If you've already registered, sign in. Otherwise, register and sign in.