- Home
- Exchange
- Exchange Team Blog
- Process Tracking Log tool for Exchange Server 2007
- Subscribe to RSS Feed
- Mark as New
- Mark as Read
- Bookmark
- Subscribe
- Printer Friendly Page
- Report Inappropriate Content
UPDATE 10/21/2011: There is now a newer version of this tool that runs also on Exchange 2010. You can read about it here.
There are many scenarios in Exchange 2007 Server which requires parsing, monitoring, and analyzing Message Tracking logs. For example, in transaction log file and / or Database growth scenarios, Server got hit with spam messages, Looping message scenario, Transport queue backup scenarios, and Server performance scenarios, and many other administrative, monitoring, and troubleshooting scenarios - it absolutely becomes necessary to review and analyze Message Tracking Logs. The amount of fields and tremendous amount of data present in message tracking logs, and the amount of extremely high messaging traffic that Exchange servers process these days ( i.e. the sheer size of message tracking log files ) makes it extremely difficult, if not impossible, to analyze these message tracking logs manually. The task is further complicated when you have to review message tracing logs from multiple servers, and especially on a pretty regular basis.
Process Tracking Log tool simplifies these tasks by automating the parsing and analysis of Message tracking logs, and then reporting it back by producing xls or txt output files with meaningful data, which is extremely useful in a lot of Administration, troubleshooting, and monitoring scenarios in Exchange 2007, as discussed above. Besides rich useful data regarding monitoring, administration, and troubleshooting, the tool also provides critical data on End-To-End Delivery Latency Distribution for all Messages Delivered, Server Latency Distribution for all Messages Processed and Server Latency Distribution for all Individual Deliveries. The tool is developed by Todd Luttinen, Principal Program Manager at Microsoft, and is released with this blog post.
Please note: the attached script is not officially supported by Microsoft. Please see the script for more details!
USAGE:
cscript ProcessTrackingLog.vbs <LogFilePath> <NumFiles> <hub|edge|all> [ <mm/dd/yyyy> | today | yesterday ]
EXAMPLES:
1) To parse one file:
cscript ProcessTrackingLog.vbs "D:\Program Files\Microsoft\Exchange Server\TransportRoles\Logs\MessageTracking\MSGTRK20070804-1.LOG" 1 all
2) To parse one file in a single directory:
cscript \data\scripts\ProcessTrackingLog.vbs "D:\Program Files\Microsoft\Exchange Server\TransportRoles\Logs\MessageTracking" 1 all
3) To parse all files in a single directory:
cscript \data\scripts\ProcessTrackingLog.vbs "D:\Program Files\Microsoft\Exchange Server\TransportRoles\Logs\MessageTracking" 0 all
4) To parse all files in all subdirectories in a single directory:
cscript \data\scripts\ProcessTrackingLog.vbs "D:\Program Files\Microsoft\Exchange Server\TransportRoles\Logs\MessageTracking" 0 all
5) To parse 3 files in each subdirectory:
cscript \data\scripts\ProcessTrackingLog.vbs "D:\Program Files\Microsoft\Exchange Server\TransportRoles\Logs\MessageTracking" 3 all
6) To parse all files in each subdirectory that were logged yesterday:
cscript \data\scripts\ProcessTrackingLog.vbs "D:\Program Files\Microsoft\Exchange Server\TransportRoles\Logs\MessageTracking" 0 all yesterday
7) To parse all files in each subdirectory that were logged on 10/29/2007:
cscript \data\scripts\ProcessTrackingLog.vbs "D:\Program Files\Microsoft\Exchange Server\TransportRoles\Logs\MessageTracking" 0 all 10/29/2007
NOTE: use of hub and edge assume "HUB" or "GWY" in directory path, otherwise specify all.
All results are stored in c:\temp\msgtrack\output directory. Please note, if you install Winzip command line tools into default path on C: drive, it will archive results.
Below are descriptions of each output file which this tool produces, along with sample data excerpts from these output files:
MTDsnFailureResults.csv includes details of all Failure reasons (although it is important to understand not all failures result in NDR). This file includes details like Timestamp, ServerName, Reason for failure, ReturnPath, and Recipients. MTDsnFailureResults.csv shows the NDR reason codes and Recipients (besides other information). If Admin is concerned about particular NDR codes or particular recipients, they can use the Filtering features of Excel (Data menu, Filter command) to quickly get statistical facts o their server or org to find out relevant inof. For example, an Admin may be interested in "550 5.2.2 STOREDRV.Deliver: mailbox full" NDR reason code and wanted to see how many users on a server actually have their mailboxes full, or during troubleshooting an issue they may be after "550 5.2.3 RESOLVER.RST.RecipSizeLimit: message too large for this recipient" or "550 5.2.3 RESOLVER.RST.SendSizeLimit: message too large for this sender" NDR reason codes. I also wanted to point out that there is a section in MTSummaryResults.txt that summarizes the NDR codes with counts by "Unique FAIL Recipient Status codes" and "FAIL Event Sources".
MTDuplicateDeliveryResults.csv output file can become very useful in troubleshooting duplicate mail delivery occurring on a particular server or across your org.
MTNextHopResults.csv includes count of messages and average message size for each next hop server via SMTP and StoreDriver. It includes stats such as, ClientName,Source, Server, MsgCount,AvgMsgBytes,MsgCountServerSLAMet, PercentServerSLAMet, and MsgCountDeliverSLAMet,PercentDeliverSLAMet. This is probably one of the 3 most important files, as pivots on this data allow for analysis of where traffic from a server is destined (if processing log files from multiple servers, can group in pivot). It should show StoreDriver, IntraOrg SMTP, and external SMTP delivery.
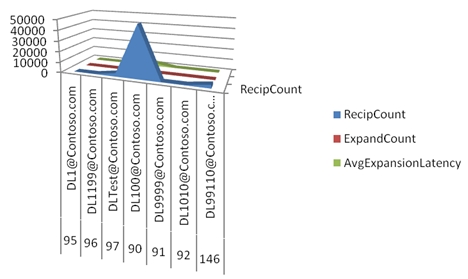
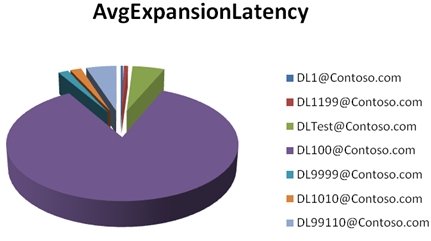
MTExpandResults.csv includes Distribution Group SMTP address, number of recipients per expansion and number of expansions performed. In the example below, MTExpandResults.csv output file shows that DL100@Contoso.com with ReciptCount of 49,426 was expanded 21 times with an AvgExpansionLatency of 3,045 sec (or 50.75 minutes). This caused Server performance issues. This output file can be very helpful in detecting these kinds of issues. AvgExpansionLatency is computed in seconds.
|
Number
|
SMTP
|
Recip
Count
|
Expand
Count
|
AvgExpansion
Latency
|
|
95
|
DL1@Contoso.com
|
116
|
1
|
14
|
|
96
|
DL1199@Contoso.com
|
228
|
2
|
24
|
|
97
|
DLTest@Contoso.com
|
3341
|
1
|
190
|
|
90
|
DL100@Contoso.com
|
49,426
|
21
|
3,045
|
|
91
|
DL9999@Contoso.com
|
374
|
1
|
59
|
|
92
|
DL1010@Contoso.com
|
458
|
1
|
65
|
|
146
|
DL99110@Contoso.com
|
3346
|
1
|
179
|
A plot of above data provides us with following graphical views:
MTLogStatistics.csv includes many statistics for each log file processed. It outputs the following data:
LogFilePath, ServerName, iLogFileEventCount, Events/MsgId, LogDateTimeStart, LogDateTimeEnd, LogDuration(Min), iAvgStoreDriverReceiveRatePerMin, iAvgSmtpReceiveRatePerMin, iAvgStoreDriverDeliverRatePerMin, iAvgSmtpSendRatePerMin, iAvgDsnFailRatePerMin, iAvgFailRatePerMin, iServerLatencyTotalCount, iPercentServerLatencySLAMet, iPercentServerLatencyRecipientsCounted, iDeliveryLatencyTotalCount, iPercentDeliveryLatencySLAMet.
These values are used to validate that the percentage of messages counted in latency SLA measurements (since we know that tracking does not have events indicating final disposition of every message handled, but most are related to our suppression of DSN's when sending to DG's that DSN suppression enabled). The Percent SLA met numbers are the most important; they show the percentile of messages that are below the server (30 sec default) and delivery (90 sec default). This is just as an example and you can modify the goal as appropriate to get percentiles they want. The server latency and delivery latency SLA goals are defined as variables in the script (defaults are 30 and 90 sec respectively). Server latency is the delay from Submission to transport until delivery/relay completed (each set of recipient deliveries counted separately). Delivery latency is the end-to-end based on difference between org submission time and final delivery event timestamp.
Note 1: Final disposition could be transfer all recipients to a bifurcated copy of the message, so it doesn't always result in delivery/relay.
Note 2: The "org submission time" is defined as the entry into transport at the header firewall (first transport server in forest). This is carried cross-forest if cross forest connectors are used between the orgs.
For example, in this output file, combination of iAvgStoreDriverReceiveRatePerMin and iAvgSmtpReceiveRatePerMin tells us the average rate that Transport is receiving messages (assuming there are no submission via Pickup and Replay directories). The combination of iAvgStoreDriverDeliverRatePerMin and iAvgSmtpSendRatePerMin gives us the average delivery rate for Transport (assuming there are no deliveries to Drop directory). The comparison of two can tell us if Transport is effectively processing messages or if Transport or one of its dependant components is a performance bottleneck. Please note, that there may be other factors which we may have to take into consideration, for example, we may have to adjust for iAvgDsnFailRatePerMin.
MTDeliveryLatencyExceptions.csv, MinDeliveryLatency and MaxDeliveryLatency are for deliveries that have occurred for the specific message (will be equal if only one delivery made). This is useful in determining when a single next hop was the cause of latency for a subset of recipients. Both measurements are in sec.
MTMbxFullRecipResults.csv includes SMTP address and count of NDR's caused due to mailbox full. For example, one of the excerpts of this output file shows the following output shown below. Here User2's "full mailbox" has resulted in 4283 NDRs. This can serve administrative and monitoring purpose to notify users (e.g. via phone message) to clean up their mailboxes, as it's resulting in unnecessary and additional overhead on Server resources.
|
Mailbox
|
DsnFailureCount
|
|
User1@ Contoso.com
|
278
|
|
User2@ Contoso.com
|
4283
|
|
User3@ Contoso.com
|
58
|
|
User4@ Contoso.com
|
19
|
|
User5@ Contoso.com
|
24
|
|
User6@ Contoso.com
|
19
|
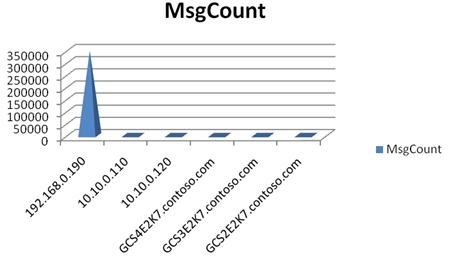
MTReceiveResults.csv includes count of messages and average message size for each host submitting via SMTP and StoreDriver. This output files produces following info: ServerName, Client IP, and MsgCount. This file is useful to show StoreDriver receive results on hub role. Below is an excerpt from this file. This clearly shows that IP address 192.168.0.190 has submitted an enormously high number of messages (349230) to the server GCS1E2K7. This definitely needed investigation, and it turned out to be a spam situation due to incorrectly configured receive connector.
|
ServerName
|
Source
|
Client
|
MsgCount
|
AvgBytes
|
|
GCS1E2K7
|
SMTP(GCS1E2K7\
Default Receive)
|
192.168.0.190
|
349230
|
294987
|
|
GCS1E2K7
|
SMTP(GCS1E2K7\
Default Receive)
|
10.10.0.110
|
1429
|
82019
|
|
GCS1E2K7
|
SMTP(GCS1E2K7\
Default Receive)
|
10.10.0.120
|
389
|
69041
|
|
GCS1E2K7
|
STOREDRIVER
|
GCS4E2K7.contoso.com
|
209
|
926738
|
|
GCS1E2K7
|
STOREDRIVER
|
GCS3E2K7.contoso.com
|
147
|
5737
|
|
GCS1E2K7
|
STOREDRIVER
|
GCS2E2K7.contoso.com
|
408
|
17774
|
|
GCS1E2K7
|
PICKUP
|
1
|
774
|
A plot between Client IP and Message Count shows the following:
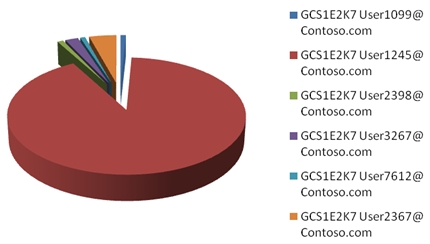
MTTopRecipientResults.csv includes SMTP address, mailbox server name and messages received for top recipients (receiving more messages than average). MTTopRecipientResults.csv shows the top recipients on the server. It provides the actual SMTP addresses of top recipients. Below is an excerpt out of this output file. In the data below User1245@ Contoso.com stands out.
|
GCS1E2K7
|
User1099@ Contoso.com
|
1950
|
|
GCS1E2K7
|
User1245@ Contoso.com
|
211738
|
|
GCS1E2K7
|
User2398@ Contoso.com
|
2124
|
|
GCS1E2K7
|
User3267@ Contoso.com
|
4784
|
|
GCS1E2K7
|
User7612@ Contoso.com
|
1861
|
|
GCS1E2K7
|
User2367@ Contoso.com
|
9898
|
Graphical representation of above data is as follows:
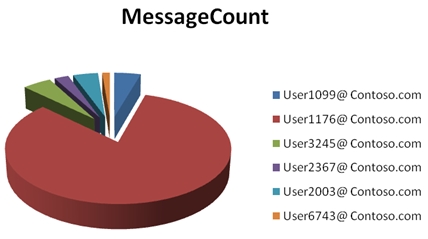
MTTopSendersbyDeliverResults.csv includes SMTP address and messages sent for top senders (sending more messages than average, includes all senders). MTTopSendersbyDeliverResults.csv provides the top senders e-mail addresses and the message count. This includes messages from senders outside the organization. In data below, User1176@ Contoso.com clearly stands out.
|
Sender
|
MessageCount
|
|
User1099@ Contoso.com
|
6074
|
|
User1176@ Contoso.com
|
112240
|
|
User3245@ Contoso.com
|
6571
|
|
User2367@ Contoso.com
|
3245
|
|
User2003@ Contoso.com
|
5732
|
|
User6743@ Contoso.com
|
1749
|
A pie chart of Top Senders data looks like this:
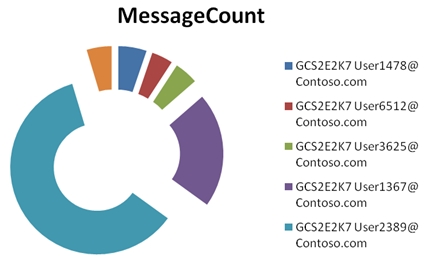
MTTopSendersbySubmitResults.csv includes SMTP address, mailbox server name and messages sent for top senders (sending more messages than average). MTTopSendersbySubmitResults.csv shows the top senders on the server. It provides the actual SMTP addresses of top senders. This only includes messages submitted from mailboxes via StoreDriver (not SMTP). Below is an excerpt out of this output file. In the data below User2389@ Contoso.com stands out.
|
MailboxServer
|
Sender
|
MessageCount
|
|
GCS2E2K7
|
|
867
|
|
GCS2E2K7
|
|
654
|
|
GCS2E2K7
|
|
727
|
|
GCS2E2K7
|
|
3532
|
|
GCS2E2K7
|
|
9984
|
|
GCS2E2K7
|
|
768
|
Graphical representation of above data is as follows:
MTEventTimeDistribution.csv shows the Event distributions based on each hour. This file is very useful for graphing over time, which is necessary to distinguish which source is submitting and to where messages are going out. For example:
|
Server
|
Event
|
Source
|
Month
|
Day
|
Hour
|
Count
|
|
GCS1E2K7
|
RECEIVE
|
SMTP(BLRKECHUB01\
Default BLRKECHUB01)
|
8
|
2
|
0
|
5198
|
|
GCS1E2K7
|
DELIVER
|
STOREDRIVER
|
8
|
2
|
0
|
3868
|
|
GCS1E2K7
|
RECEIVE
|
STOREDRIVER
|
8
|
2
|
0
|
341
|
|
GCS1E2K7
|
DSN
|
DSN(Delivery)
|
8
|
2
|
0
|
47
|
|
GCS1E2K7
|
SEND
|
SMTP(Intra-Organization SMTP Send Connector)
|
8
|
2
|
0
|
2169
|
|
GCS1E2K7
|
DSN
|
DSN(Failure)
|
8
|
2
|
0
|
93
|
|
GCS1E2K7
|
FAIL
|
STOREDRIVER
|
8
|
2
|
0
|
93
|
|
GCS1E2K7
|
BADMAIL
|
DSN
|
8
|
2
|
0
|
87
|
|
GCS1E2K7
|
FAIL
|
ROUTING
|
8
|
2
|
0
|
87
|
|
GCS1E2K7
|
TRANSFER
|
ROUTING(Resolver)
|
8
|
2
|
0
|
55
|
|
GCS1E2K7
|
TRANSFER
|
ROUTING(Content
Conversion)
|
8
|
2
|
0
|
66
|
|
GCS1E2K7
|
REDIRECT
|
ROUTING
|
8
|
2
|
0
|
1
|
|
GCS1E2K7
|
EXPAND
|
ROUTING
|
8
|
2
|
0
|
6
|
|
GCS1E2K7
|
FAIL
|
AGENT(FSE Routing Agent)
|
8
|
2
|
0
|
2
|
|
RECEIVE
|
AGENT()
|
8
|
2
|
0
|
2
|
|
|
GCS1E2K7
|
DEFER
|
AGENT(Transport Rule Agent)
|
8
|
2
|
0
|
2
|
|
GCS1E2K7
|
DELIVER
|
STOREDRIVER
|
8
|
2
|
1
|
4748
|
|
GCS1E2K7
|
RECEIVE
|
SMTP(BLRKECHUB01\
Default BLRKECHUB01)
|
8
|
2
|
1
|
6492
|
|
GCS1E2K7
|
RECEIVE
|
STOREDRIVER
|
8
|
2
|
1
|
389
|
|
GCS1E2K7
|
DSN
|
DSN(Delivery)
|
8
|
2
|
1
|
35
|
|
GCS1E2K7
|
SEND
|
SMTP(Intra-Organization SMTP Send Connector)
|
8
|
2
|
1
|
2809
|
|
GCS1E2K7
|
TRANSFER
|
ROUTING(Resolver)
|
8
|
2
|
1
|
152
|
|
GCS1E2K7
|
TRANSFER
|
ROUTING(Content
Conversion)
|
8
|
2
|
1
|
65
|
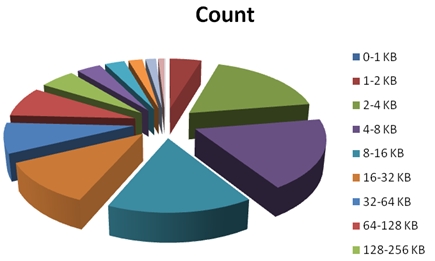
MTMessageSizeDistribution.csv shows the distribution of messages according to the size of messages. It breaks it down according to number of messages, percentage of Total, and percentage under current size. This helps tremendously figuring out the entire spectrum of your message size distribution.
|
SizeRange
|
Count
|
PercentofTotal
|
PercentileUnderCurrentSize
|
|
0-1 KB
|
63
|
0.02%
|
0.02%
|
|
1-2 KB
|
11846
|
4.66%
|
4.68%
|
|
2-4 KB
|
45172
|
17.76%
|
22.44%
|
|
4-8 KB
|
47072
|
18.50%
|
40.94%
|
|
8-16 KB
|
39641
|
15.58%
|
56.53%
|
|
16-32 KB
|
28810
|
11.33%
|
67.85%
|
|
32-64 KB
|
20251
|
7.96%
|
75.81%
|
|
64-128 KB
|
20252
|
7.96%
|
83.77%
|
|
128-256 KB
|
13228
|
5.20%
|
88.97%
|
|
256-512 KB
|
9022
|
3.55%
|
92.52%
|
|
512-1024 KB
|
7460
|
2.93%
|
95.45%
|
|
1024-2048 KB
|
5243
|
2.06%
|
97.51%
|
|
2048-4096 KB
|
3925
|
1.54%
|
99.05%
|
|
4096-8192 KB
|
2399
|
0.94%
|
100%
|
|
8192-16384 KB
|
5
|
0%
|
100%
|
|
16384-32768 KB
|
0
|
0%
|
100%
|
|
32768-65536 KB
|
0
|
0%
|
100%
|
A pie chart of the above distribution in terms of count would look like this:
MTRecipientNotFoundResults.csv shows the stats about recipients which could not be found in GAL / AD. Example below shows User1001 has account of 2149, which could mean a user who is no longer with the company.
|
RecipientNotFound
|
Count
|
|
User1001@ Contoso.com
|
2149
|
|
User2167@ Contoso.com
|
19
|
|
User3267@ Contoso.com
|
6
|
|
User1282@ Contoso.com
|
6
|
|
User1491@ Contoso.com
|
8
|
|
User2139@ Contoso.com
|
6
|
|
User4359@ Contoso.com
|
6
|
MTDomainExpiredResults shows results, which are useful on Edge role when messages result in DSN failure (mistyped or destination down for longer than 2 days, default expiration timeout).
|
Domain
|
Recip
Failures
|
Msg
Failures
|
OriginalExpire
DateTime
|
LastExpire
DateTime
|
MTBF
(Hours)
|
|
Hotmail.com
|
6
|
6
|
1/9/2008 19:06
|
1/11/2008 20:20
|
8
|
|
contoso.com
|
7
|
7
|
1/9/2008 3:47
|
1/12/2008 8:13
|
11
|
|
fourthcoffee.com
|
4
|
4
|
1/9/2008 19:15
|
1/10/2008 15:51
|
5
|
|
msn.com
|
23
|
23
|
1/9/2008 20:40
|
1/11/2008 17:10
|
2
|
I would like to add a note regarding MTMessageSizeExceptions output file, this should only be produced if there was a tracking log event for a message with size exceeding iMaxMessageSizeThresholdKB (default threshold is 64MB). Otherwise this file will not be produced as an output file.
MTRunTimeLog.log is the actual run time log for the tool itself i.e.processtrackinglog.vbs
MTMailSubmissionDistribution.csv helps in determining distribution of client types when the mailbox role tracking log is analyzed. It shows the distribution of submissions by MessageClass and ClientType. This includes the ability to parse the SUBMIT event SourceContext field in order to determine distribution of submissions by ClientType and MessageClass. This relies on Mailbox role tracking logs.
MTSummaryResults.txt includes summary statistics for all log files processed. It's hard to document everything this file outputs as there is a lot but some of the things of interests are: Total Events processed, Total Message Id's Processed, Total Messages received, Total Messages sent, Total Messages delivered, Total Messages delivered (duplicate), Total Resolve, Total Transfer, Total Expand, Total Fail, Total Fail with NDR, Total Fail (valid Return Path), Total Fail (Recipient), Avg Fail Events/Min, Max Fail Events/Min, Max DSN(Fail) Events/Min, Total DSN Generated, Total DSN Badmail, Total DSN, Total DSN Delivered from CORP, Total Null Reverse Path Delivered, Total Null Reverse Path Delivered from Internal, Total Null Reverse Path Delivered from External, Total Defer, Total Poison, Total SMTP Receive, Total StoreDriver Receive, Total SMTP Send, Total StoreDriver Deliver, Total Expand, etc.
Additionally, it also outputs End-To-End Delivery Latency Distribution for all Messages Delivered, Server Latency Distribution for all Messages Processed, Server Latency Distribution for all Individual Deliveries, Unique Encapsulated Addresses, Unique DSN Source Context, Unique Defer Source Context, Unique StoreDriver Sender Domains, Transfer Source Context, FAIL Event Sources, Unique FAIL Recipient Status codes, etc. A very small sample excerpts from MTSummaryResults.txt follows:
Total Events processed: 671316 (Avg Events/Log: 26852.64)
Total Message Id's Processed: 291378 (Avg Events/MsgId: 2.30393509461936, Max: 3.03358797138353, Min: 1.41262468992453)
Total Messages received: 254389 (Avg Msg Size: 184 KB)
Total Messages sent: 95301
Total Messages delivered: 256995
Total Messages delivered (duplicate): 0 (0 recipients)
Total Resolve: 45
Total Transfer: 32610 (46.9% exceeded 30 sec before transfer, average 599 sec latency before transfer)
Total Expand: 5179
Total Fail: 10229 (0% *.contoso.com senders, 99.6% external senders)
Total Fail with NDR: 5759
Total Fail (valid Return Path): 5802 (0% *.contoso.com senders, 100% external senders)
Total Fail (Recipient): 11203
Avg Fail Events/Min: 7.1
Max Fail Events/Min: 280.3
Max DSN(Fail) Events/Min: 146.5
Total DSN Generated: 7240
Total DSN Badmail: 4352
Total DSN: 11592 (Percent DSN Badmail: 37.5%)
Total DSN Delivered from CORP: 0
Total DSN Delivered from CORP/EXCHANGE/NWTRADERS: 0
Total Null Reverse Path Delivered: 8604
Total Null Reverse Path Delivered from Internal: 3 (0%)
Total Null Reverse Path Delivered from External: 8601 (100%)
Total Defer: 42
Total Poison: 0
Total Split Errors: 22120
The script itself can be obtained from here.
You must be a registered user to add a comment. If you've already registered, sign in. Otherwise, register and sign in.