- Home
- Exchange
- Exchange Team Blog
- Exchange Client Bandwidth Prediction – the time zone problem…
- Subscribe to RSS Feed
- Mark as New
- Mark as Read
- Bookmark
- Subscribe
- Printer Friendly Page
- Report Inappropriate Content
6/22/12 Update - This article and the accompanying download have been updated.
The latest release of the Exchange Client Network Bandwidth Calculator includes several updates but arguably the most significant is time zone support. I have been looking at how to deal with the time zone problem for the last 12 months or so and it’s taken a while to come up with a practical solution. However, I am getting ahead of myself, so firstly let’s look at what the time zone problem actually is.
What is the time zone problem?
I am going to assume that everyone knows what time zones are and why we have them, however for those that want to know more I recommend reading the Wikipedia article below;
http://en.wikipedia.org/wiki/Time_zone
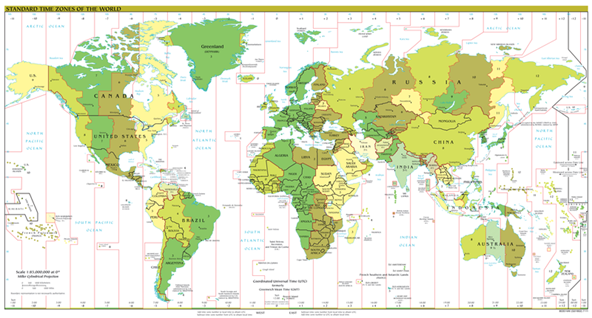
The actual problem with time zones from a network bandwidth prediction perspective is that we may be trying to model workloads from users in different parts of the world who are sharing either the same network connection or the same end service. This causes us a problem since the peak usage times for most users is relative to their local time zone;
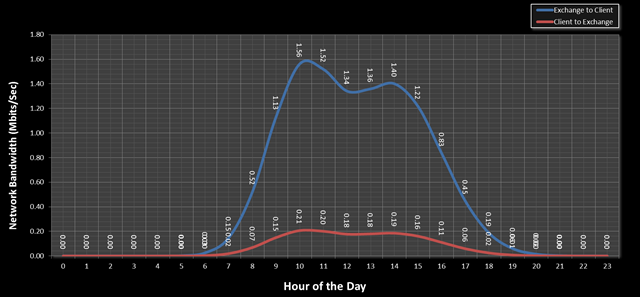
For example, if we look at a normal working day for an average 1000 user organization we see two typical peaks, one in the morning around 10am that lasts for 2 hours and a later peak in the afternoon at around 2pm that lasts for 4 hours. When we plot this it looks as follows;
Now, let’s imagine that we are modelling the requirements for 5 different locations around the world, each supporting 1000 users accessing a shared resource in New York. At this stage let’s assume that the shared resource is a load balancer fronting Exchange 2010 on-premises (I thought I would choose an on-prem example for a change J)
- London (GMT) = 1000 users
- Warsaw (GMT+1) = 1000 users
- Jakarta (GMT+7) = 1000 users
- Redmond (GMT-8) = 1000 users
- New York (GMT-5) = 1000 users
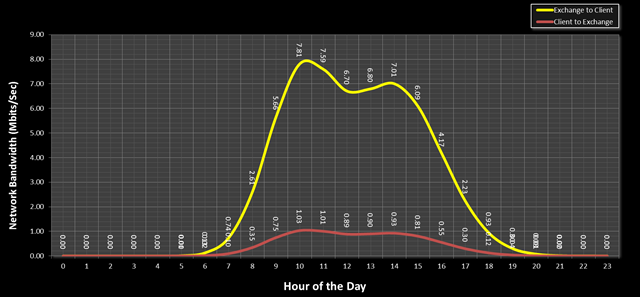
If we model this using our legacy technique of predicting the peak for each set of users and adding them together we get the following;
What this chart is showing is that each site of 1000 users required roughly 1.56Mbits/sec of bandwidth at their peak each day and so when we add them all together to account for all of the users sharing the load balancer in New York, we get a peak requirement of 7.81Mbits/sec. This is how we have historically dealt with bandwidth planning for distributed users, predict their peak requirements then stick them all in a table and add them together.
The issue here is that the users in Europe will be going home when the users in Redmond are just waking up and the users in Jakarta will be tucked up in bed!
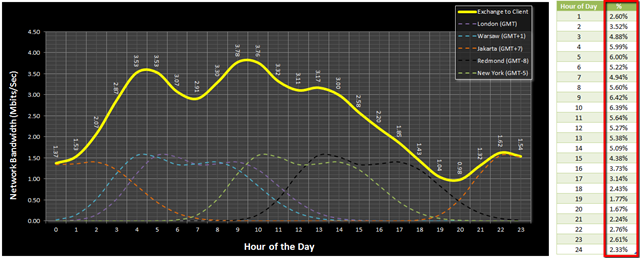
If we take the time zone of these sites into account then the chart changes significantly;
This chart shows how the workloads would actually combine to form a very different usage profile than we would have historically planned for. What is really interesting here is that our peak workload is now much lower at only 3.78Mbits/sec (our original prediction was 7.81Mbits/sec). The usage profile is also very different to our original prediction.
How can we deal with this problem?
Well, as you may have guessed from the charts above we have extended the network calculator to allow you to include time zone details!
What we actually did to achieve this was to abandon the idea of predicting only the peak workload and instead we now predict bandwidth usage per hour of the day based on the usage patterns provided such as when is the morning peak time and afternoon peak time etc. This allows the calculator to not only know when your peak usage will be, but also what the usage will be like throughout the rest of the day. Once we know what this curve looks like it becomes possible to add the data together accounting for time zones.
Does anyone really do this single consolidation?
Well, the simple answer to this is yes – many organisations are consolidating workloads as much as possible. This is requiring design teams to plan for service workloads from very distributed users; often with different profiles and in different time zones. This is especially common where workload is moved to the cloud since Office 365 provides only single regional tenant locations and so a global organisation using Office 365 will have to plan for a large proportion of its users accessing the service in a totally different region and time zone, often over shared infrastructu re.
Many customers I work with are also consolidating many smaller datacentres into fewer, larger datacentres – these consolidated sites must be able to handle the workload from the previously distributed users, quite often these users will be in different time zones and so when we try to accommodate their workload we need a way to figure out how they will combine with other distributed workloads.
Obviously, if all of your users exist in the same time zone then you do not need to concern yourself with all of this and just use the calculator as normal.
Using the new time zone feature
Ok, so you have a scenario that requires time zone support, how on earth do you make use of the new feature?
First things first, we need to configure the TimeZone configuration table in on the input sheet. The parameters entered here control the shape of the usage curve used to combine the workloads. The values here need to reflect the average usage patterns within your organisation, I typically will take a look at performance data from running Exchange servers to create this, combined with asking the customer how they think that their users work and when their peak times are.
Once the input sheet is completed, we move to the Client Mix sheet – on here we have two new areas to configure time zone data.
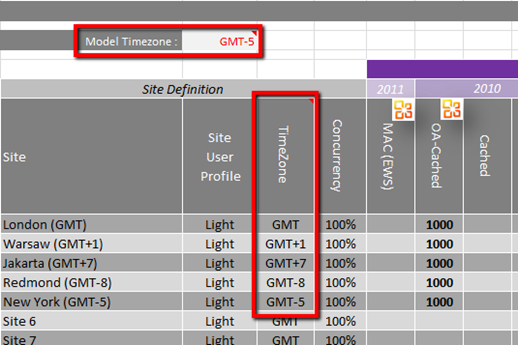
First is the Model Timezone, this represents the time zone of the resource we are planning for, i.e. the network link or load balancer. In the example earlier you can see that I have set the model time zone to be GMT-5 for New York which is where our load balancer was.
Second we have a new column called TimeZone – this represents the time zone of each individual site relative to GMT (note I am British and went with GMT here, but I may move this to UTC in the future if enough people complain).
The resulting prediction is shown in a chart underneath the client mix table as shown earlier. The values in this table are Mbits/sec and represent the predicted network usage at each hour of the day.
An Added Bonus
One of the other nice features is that the calculator will provide a table that can be copied into the Mailbox Role Calculator to help with DAG network replication prediction.
If you look to the right of the prediction chart (Client Mix Sheet) in the Network Calculator you will see a table that contains % change per hour of the day… if you copy this onto your clipboard…
Then scroll to the bottom of the Input sheet in the Mailbox Server Role Calculator, you will find a table for Log Replication Configuration. Paste the figures from the Network Calculator into this table.
And there you have it, the Mailbox Server Role Calculator is now able to predict the bandwidth requirements for DAG replication taking both your organisation data and timezone configuration into account!
Conclusion
Hopefully this new feature will help many of you more accurately predict your network bandwidth requirements; it is not necessary for all deployments but for those large enterprise architects out there struggling with this problem I hope that the time zone feature helps you.
Please continue to provide your valuable feedback - both positive and negative, to the netcalc AT microsoft.com address. We love to read your comments!
Neil Johnson
Senior Consultant, MCS UK
You must be a registered user to add a comment. If you've already registered, sign in. Otherwise, register and sign in.
