- Subscribe to RSS Feed
- Mark Discussion as New
- Mark Discussion as Read
- Pin this Discussion for Current User
- Bookmark
- Subscribe
- Printer Friendly Page
- Mark as New
- Bookmark
- Subscribe
- Mute
- Subscribe to RSS Feed
- Permalink
- Report Inappropriate Content
Sep 08 2018 07:23 AM
Hello all. That seems a basic question but it is confusing me.
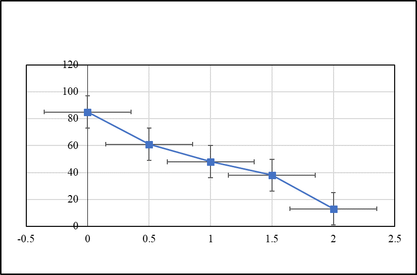
I submitted a paper to journal with chart. This chart represents the results of experimental work. The reviewer asked me to add error bars to the figure, and when I did , it seems to have no meaning since the results are not trials, the data is one column for x and one column for y. I'm I missing something I should process in excel before adding the error bars? I attached the chart and data.
x | y |
0 | 85 |
0.5 | 61 |
1 | 48 |
1.5 | 38 |
2 | 13 |
- Labels:
-
error bars
- Mark as New
- Bookmark
- Subscribe
- Mute
- Subscribe to RSS Feed
- Permalink
- Report Inappropriate Content
Sep 08 2018 08:47 AM
Hi Sahar,
Please check this what are the options for error bars https://support.office.com/en-us/article/add-change-or-remove-error-bars-in-a-chart-e6d12c87-8533-4c...
- Mark as New
- Bookmark
- Subscribe
- Mute
- Subscribe to RSS Feed
- Permalink
- Report Inappropriate Content
Sep 11 2018 05:50 AM
Hello Sergei
Thank you so much for the reply. I'm totally aware how to do these, I'm just having trouble apply it to my data. I have only one Y and one X value for each input so no error calculations. do I just assume I need to show error of fixed value, for example SD=0.5 and plot the error bars for it?
- Mark as New
- Bookmark
- Subscribe
- Mute
- Subscribe to RSS Feed
- Permalink
- Report Inappropriate Content
Sep 11 2018 07:04 AM
SolutionSahar, yes, you may show errors as fixed value (same for each point); or as fixed per cent from each point value; or standards error (standard deviation divided by the square root of the sample size); or standard deviation on your series.
And if you have your own errors you may add two columns (for plus and minus) and show them as your custom error values.
Accepted Solutions
- Mark as New
- Bookmark
- Subscribe
- Mute
- Subscribe to RSS Feed
- Permalink
- Report Inappropriate Content
Sep 11 2018 07:04 AM
SolutionSahar, yes, you may show errors as fixed value (same for each point); or as fixed per cent from each point value; or standards error (standard deviation divided by the square root of the sample size); or standard deviation on your series.
And if you have your own errors you may add two columns (for plus and minus) and show them as your custom error values.

