- Home
- Azure
- Azure Observability
- Microsoft Azure Central Monitoring for your Team Dashboards
Microsoft Azure Central Monitoring for your Team Dashboards
- Subscribe to RSS Feed
- Mark Discussion as New
- Mark Discussion as Read
- Pin this Discussion for Current User
- Bookmark
- Subscribe
- Printer Friendly Page
Jun 25 2019
10:26 PM
- last edited on
Apr 07 2022
05:58 PM
by
TechCommunityAP
- Mark as New
- Bookmark
- Subscribe
- Mute
- Subscribe to RSS Feed
- Permalink
- Report Inappropriate Content
Jun 25 2019
10:26 PM
- last edited on
Apr 07 2022
05:58 PM
by
TechCommunityAP
Full Screen Monitoring
When you install Azure Virtual Machines or Kubernetes Clusters in the Microsoft Cloud, It’s important to monitor your workload and keep your IT department in Control for the Business. Metric alerts in Azure Monitor work on top of multi-dimensional metrics. These metrics could be platform metrics, custom metrics, popular logs from Azure Monitor converted to metrics and Application Insights metrics.
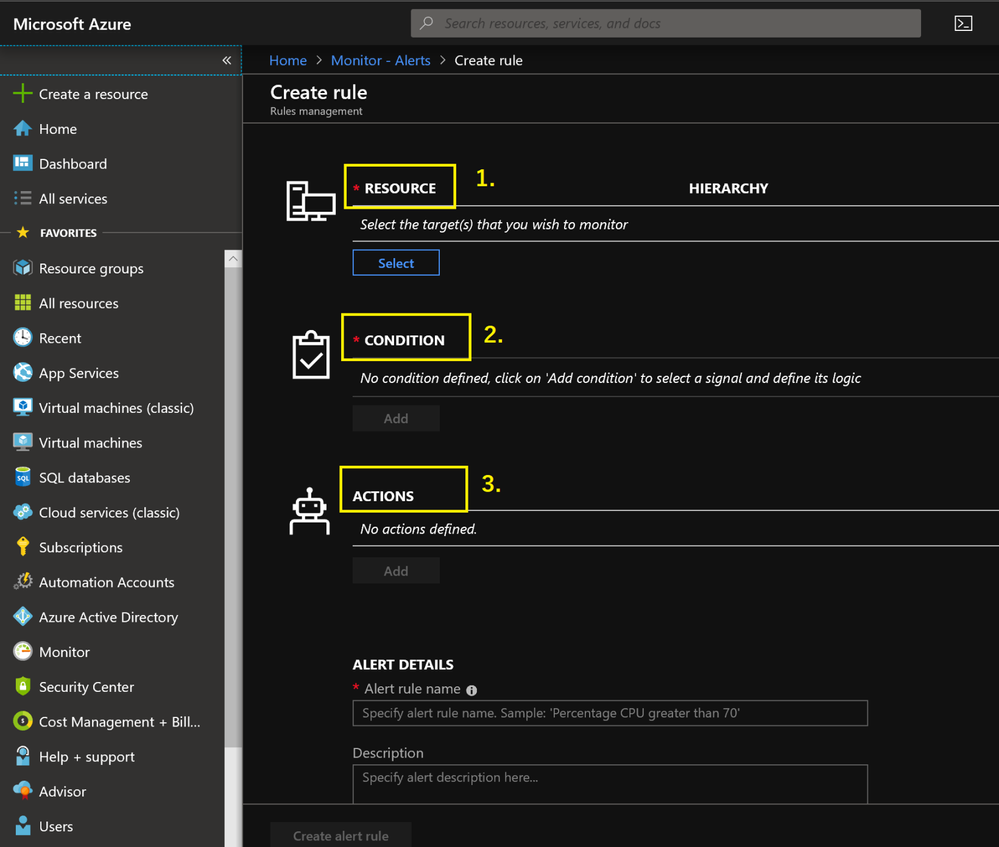
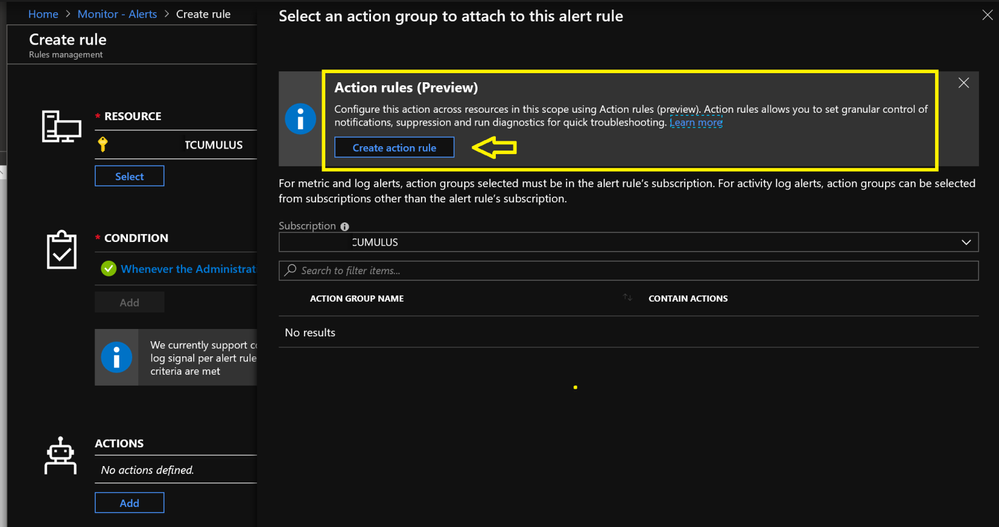
When you have important alerts, you want to take action based on your rules.
Take action on Alerts
Make your Own rules based on Alerts.
IT Department of a company has most of the time different teams with each having it’s own responsibility of workloads in the Microsoft Cloud. For example, the Servicedesk is supporting the Business and they like to see if all the Services are up and running for the Business. The Infrastructure Team wants the same, but on deep level components of the Services like Memory, Network, Storage, CPU, Performance, Availability and more. The Technical Application Team is interested if the application is running and working with all the Interfaces, Databases, and/or Azure Pipelines.
Each Team can build there own Azure Dashboard(s) in the Microsoft Cloud.
Read the complete blogpost here

- Labels:
-
Azure Monitor


