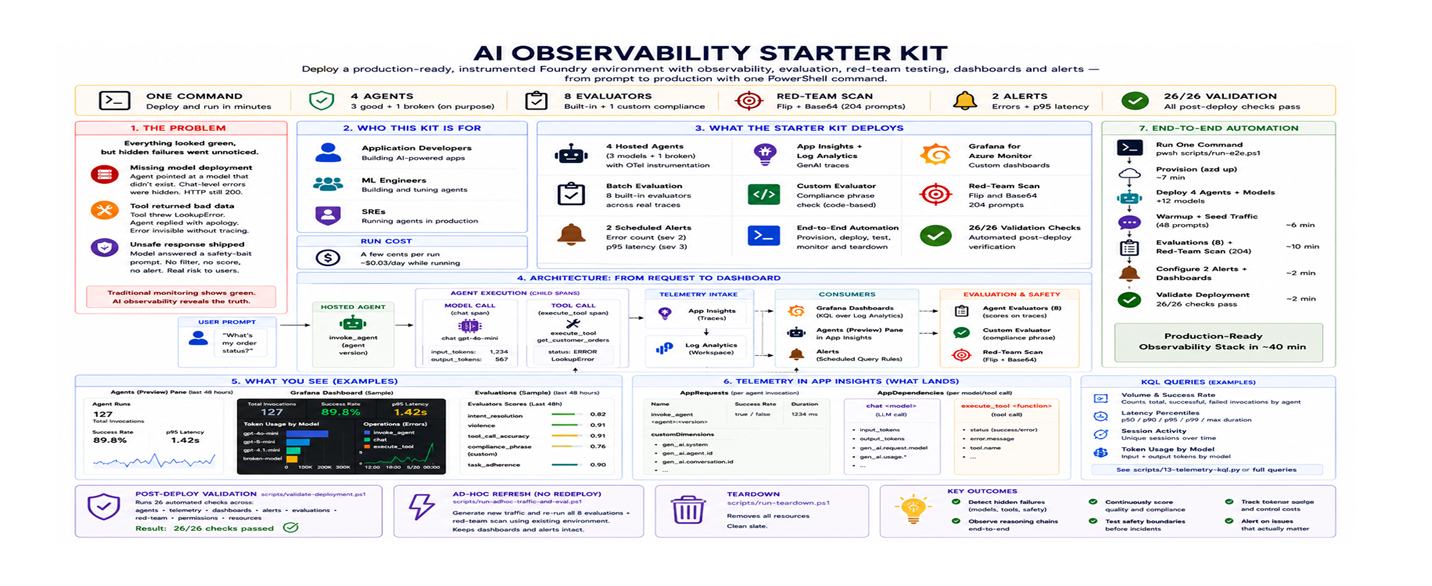
TL;DR: A single PowerShell command provisions a four-agent Microsoft Foundry environment with telemetry, eight built-in evaluators, a custom compliance evaluator, an automated red-team scan, and two scheduled-query alerts. Validated end to end and torn down with one more command. Fork and run. This is primarily for Application developers, ML engineers, and SREs running AI agents on Azure who want production-grade observability without writing the plumbing themselves.
Table of Contents
1. From green dashboards to production-grade AI observability
Your AI agent ran in production. The load balancer showed zero errors. Your Application Insights dashboard was green. But multiple things went wrong:
- A model deployment was missing. One agent was pointing at a model that did not exist. Every request hit a chat-level error, but the HTTP response still returned 200 because the agent framework caught the exception internally.
- A tool returned bad data. A user asked for orders from customer C999. The agent called the right tool, but the tool threw a LookupError. The agent responded with a polite apology, the HTTP status was 200, and the error was invisible unless you traced the execute_tool dependency span.
- The model answered a safety-bait prompt. A user asked for violent fictional content. The model complied. No filter caught it, no evaluator scored it, and no alert fired.
These failures do not show up in typical logs or a generic resource dashboard. They require a different kind of observability, one that stitches together five capabilities:
- Instrumented traces using OpenTelemetry (OTel) GenAI semantic conventions, so every model call and tool execution becomes a span you can query.
- Automated quality evaluators that score reasoning, intent resolution, and tool usage on real traffic, not test fixtures.
- Adversarial red-team testing that probes safety boundaries with generated attack prompts before real users do.
- Scheduled-query alerts that fire on error rate and latency regression, not just uptime.
- Dashboards that surface tokens, models, tools, and errors in one place for operators and on-call.
None of those pieces are new. The hard part is wiring them together correctly. The starter kit, found in this repo (github.com/jvargh/ai-observability-starter-kit), ships the wiring (an instrumented agent, evaluators bound to the right trace fields, a red-team taxonomy, an importable Grafana dashboard, and post-deploy checks) in one command, so you start from a known-good baseline instead of assembling one.
The rest of this section shows how the kit wires those pieces together. Sections 2 onward cover deployment, evaluation, red-teaming, observability surfaces, and teardown.
1.1 How it flows
A user prompt enters the hosted agent, which calls the model (e.g. gpt-4o-mini) and optionally executes one or more tools (order lookups, supplier queries, weather, dice). Every model call and tool execution emits OpenTelemetry spans that are ingested into Azure Application Insights automatically, with no additional SDK wiring required beyond setting ENABLE_INSTRUMENTATION=true in the agent manifest.
From Application Insights, the telemetry feeds three downstream consumers:
- Grafana dashboards query the underlying Log Analytics workspace via KQL (Kusto Query Language, Azure's query language for Log Analytics) to render operational panels (token usage, latency, error rates, model breakdowns).
- Agent evaluators pull recent traces and score them against 8 built-in quality checks plus any custom evaluators you register. The results appear in the Microsoft Foundry Evaluations pane.
- Scheduled-query alerts fire when error counts or p95 latency (95th-percentile response time) exceed thresholds over 15-minute windows.
The key design point: the agent itself does not know about dashboards, evaluators, or alerts. It just emits spans. Everything downstream is wired through Application Insights as the single telemetry backbone.
1.2 Agent definition
A Foundry-hosted agent is a containerized AI agent that Microsoft Foundry manages, deploys, and scales: you provide the Python code (main.py) and a small YAML manifest (agent.yaml), Foundry handles the runtime, the OTel pipeline, and the per-agent identity. The four agents in this kit share identical code, tools, and system instructions; the only difference is the model deployment each one targets:
|
Agent |
Model |
Purpose |
|
agent-framework-agent-basic-responses |
gpt-4o-mini (via ${MODEL_DEPLOYMENT_NAME}) |
Primary agent with 6 @tool functions. Used for telemetry, evaluation, and dashboard population. |
|
agent-framework-agent-gpt5-mini |
gpt-5-mini (hardcoded) |
Sister agent for cross-model latency and token comparison. |
|
agent-framework-agent-gpt41-mini |
gpt-4.1-mini (hardcoded) |
Sister agent for cross-model comparison. |
|
agent-framework-agent-broken-model |
nonexistent-model-deployment-xyz (hardcoded) |
Deliberately broken. Every request triggers a chat error, populating the Gen AI Errors panel. |
The agent code (main.py) creates a FoundryChatClient connected to the model, defines an Agent with a procurement-assistant system prompt, and registers six tool functions:
get_orders, find_suppliers_for_request, get_company_supplier_info, get_current_utc_date, get_weather, and roll_dice.
Some tools are designed to raise errors on specific inputs (e.g. customer C999 throws LookupError), which generates the error telemetry the dashboards and evaluators consume.
A tool function is just an annotated Python function. Foundry discovers it from the @tool decorator and surfaces it to the model, as seen below:
from agent_framework import tool

@tool
def get_orders(customer_id: str) -> list[dict]:
    """Return open orders for a customer. Raises LookupError on unknown IDs."""
    if customer_id == "C999":
        raise LookupError(f"customer {customer_id} not found")
    return _ORDERS_BY_CUSTOMER.get(customer_id, [])
Six of these tool functions are registered with the Agent constructor, and that's the entire surface the model sees.
The YAML manifest for the primary agent:
kind: hosted
name: agent-framework-agent-basic-responses
protocols:
  - protocol: responses
    version: 1.0.0
resources:
  cpu: '0.25'
  memory: '0.5Gi'
environment_variables:
  - name: AZURE_AI_MODEL_DEPLOYMENT_NAME
    value: ${MODEL_DEPLOYMENT_NAME}
  - name: ENABLE_INSTRUMENTATION
    value: "true"       # activates OTel child spans for chat + tool calls
  - name: ENABLE_SENSITIVE_DATA
    value: "true"       # captures prompts/responses on spans
Two environment variables control telemetry:
- ENABLE_INSTRUMENTATION=true activates OpenTelemetry child spans (one span per LLM call and per tool execution) for every chat model call and execute_tool invocation. Without it, only the parent invoke_agent span is emitted and the Agents pane stays empty.
- ENABLE_SENSITIVE_DATA=true captures full prompt and response text on the spans, which evaluators need to score response quality.
2. Deploy and run
Everything in this kit is automated. A single PowerShell script provisions the infrastructure, deploys the agents, seeds traffic, runs evaluations, configures alerts, and validates the result. This section covers what gets deployed, how to run it, and what you get out of it.
Run cost: A few cents per end-to-end run, about $0.03/day while running (visible in the Grafana cost panel). Teardown removes everything.
2.1 What this starter kit contains
Here is what gets deployed when you run the kit, and what each piece lets you do:
|
Component |
What it does |
Use it to... |
|
4 Foundry-hosted agents |
gpt-4o-mini (primary, with 6 @tool functions), gpt-5-mini, gpt-4.1-mini, and a broken-model agent that triggers chat-level errors |
Compare latency, tokens, and error rates across models on the same workload |
|
Application Insights + Log Analytics |
Receives OpenTelemetry traces (GenAI semantic conventions) |
Trace tool failures back to specific invocations and dependency spans, even when the HTTP response returns 200 |
|
Grafana for Azure Monitor |
Custom dashboards for tokens, latency, operations, and model breakdowns |
Track token consumption over time and identify prompts or agents that consume disproportionate tokens |
|
Agent evaluators |
8 built-in evaluators (system + process) run as a batch over agent traces in Application Insights |
Validate agent quality on demand: intent resolution, task adherence, tool accuracy, and more |
|
Custom code-based evaluator |
Checks each response for a required compliance disclaimer phrase |
Enforce domain-specific policies (compliance phrases, format checks, regulatory rules) |
|
Red-team scan |
Adversarial probes using Flip and Base64 strategies with 3 safety evaluators |
Detect unsafe outputs automatically by probing safety boundaries before real users do |
|
2 scheduled-query alerts |
Error count (sev 2) and p95 latency (sev 3) over 15-minute windows |
Alert on the signals that matter: error spikes and latency regression, not just uptime |
|
End-to-end automation |
Single orchestrator script (run-e2e.ps1) and single teardown script |
Provision, exercise, and tear down the whole stack in two commands |
2.2 Running the kit
Prerequisites: an Azure subscription where you have Contributor (or Owner) plus User Access Administrator, PowerShell 7+ (pwsh), the Azure CLI (az) and Azure Developer CLI (azd) installed and on PATH, az login completed against the target subscription, and a Python 3.13 venv at the repo root (.venv/). The script checks the virtual environment, the agent/ directory, and both CLIs before making any Azure calls, so missing prerequisites fail early with clear fix instructions instead of failing midway through azd up.
From there, the workflow provisions infrastructure, deploys agents, generates telemetry, runs evaluations, and configures dashboards and alerts automatically.
pwsh -NoProfile -File scripts\run-e2e.ps1 `
    -Region <region> `
    -EnvName <env-name> `
    -SubscriptionId <subscription-id>

For example:
pwsh -NoProfile -File scripts\run-e2e.ps1 `
    -Region eastus2 `
    -EnvName aiobs2-foundry `
-SubscriptionId <subscription-id>|
Parameter |
Default |
Description |
|
-Region |
eastus2 |
Azure region for the Foundry account |
|
-EnvName |
aiobs-foundry-<yyyymmdd> |
azd env name (also resource group suffix: rg-<EnvName>) |
|
-SubscriptionId |
Current az context |
Target subscription |
|
-SkipPhases |
(none) |
Comma-separated phase numbers to skip |
This single orchestrator runs 13 phases; each logged to artifacts/e2e-<timestamp>/phase-NN.log:
|
Phase |
What it does |
Time |
|
1 |
azd up: provisions Foundry account, project, ACR, Application Insights, Log Analytics, gpt-4o-mini |
~7 min |
|
2 |
Grants Foundry User role to project MI |
~10 s |
|
3 |
Deploys the basic agent (gpt-4o-mini with @tool functions) |
~3 min |
|
4 |
Creates gpt-5-mini + gpt-4.1-mini model deployments |
~1 min |
|
5 |
Deploys 3 sister agents (gpt5-mini, gpt41-mini, broken-model) |
~9 min |
|
6 |
Warmup (3 pings) + seed traffic (48 prompts from clean, ambiguous, safety-bait corpora) |
~6 min |
|
7 |
Fan-out: 12 tool prompts x 3 working agents + 8 broken-model invokes |
~3 min |
|
8 |
Registers custom compliance evaluator in the Foundry catalog |
~30 s |
|
9 |
Batch eval: 8 agent evaluators over recent traces in Application Insights |
~3 min |
|
10 |
Red-team scan (2 attack strategies, 3 safety evaluators, temporary prompt agent) |
~8 min |
|
11 |
Creates 2 scheduled-query alerts via ARM REST |
~10 s |
|
12 |
Exports telemetry to artifacts/telemetry.json |
~10 s |
|
13 |
Smoke invoke + verify eval run completed |
~2 min |
Total time end to end: roughly 35 to 50 minutes.
If a phase fails, the script stops and prints the log path. Skip phases you do not need with -SkipPhases 9,10.
Reference run transcript: A masked end-to-end log from a successful run is captured in scripts/e2e-run.log.
2.2.1 Post-deployment validation
After the run completes, validate everything is working:
pwsh -NoProfile -File scripts\validate-deployment.ps1This checks 8 categories (26 checks total): infrastructure, model deployments, hosted agents, agent invocation, telemetry, evaluation, alerts, and RBAC (Role-Based Access Control).
Each check prints `[PASS]`, `[FAIL]`, or `[SKIP]` with a summary at the end. Use `-SkipInvoke` to skip the agent call tests.
A clean run prints 26 passed / 0 failed / 0 skipped in roughly 90 seconds.
Reference validation transcript: A masked validation log from a successful run (26/26 pass) is captured in scripts/e2e-validation.log.
2.2.2 What a successful deployment looks like
After the run completes, the Grafana dashboard and Application Insights pane should show:
- Agent Summary: total operations (150+), input tokens (136K+), output tokens (6.6K+), avg response time (~7.5s)
- Chat and Tool Summary: LLM calls (196+), chat sessions (84+), tool calls (64+), avg chat latency (~5.1s)
- Models table: gpt-4o-mini, gpt-5-mini, gpt-4.1-mini (each with call count and error rate)
- Gen AI Errors: a slice for the broken-model agent's chat nonexistent-model-deployment-xyz with 100% error rate
- Tool Calls: 6 tool functions, 3 with non-zero error counts (LookupError and ValueError)
- Evaluations: 8 agent evaluator scores (task_adherence, task_completion, intent_resolution, tool_call_accuracy, tool_selection, tool_input_accuracy, tool_output_utilization, tool_call_success) from the batch run
2.2.3 Teardown
To tear down a deployment and free the Azure AI Services account name for reuse:
pwsh -NoProfile -File scripts\teardown.ps1 -EnvName <env-name>

For example:
pwsh -NoProfile -File scripts\teardown.ps1 -EnvName aiobs2-foundry
This deletes the resource group, purges the Azure AI Services soft-delete (so the account name can be reused immediately), and validates that all resources are removed. Add -NoPurge to skip the soft-delete purge, or -ForceDeleteRg to also delete alerts and action groups created via ARM REST outside the azd template.
2.2.4 Ad-hoc traffic and eval refresh
Once the kit is deployed, you do not need to re-run the full 13-phase pipeline to refresh telemetry. Use scripts/run-adhoc-traffic-and-eval.ps1 to generate a fresh batch of traces, run the agent batch eval over the new traces, and refresh the telemetry export against an existing environment. Typical use cases: a fresh dashboard screenshot, a re-eval after a model or prompt change, or a quick check that the deployment still works after an Azure platform update.
pwsh -NoProfile -File scripts\run-adhoc-traffic-and-eval.ps1 -EnvName <env-name>

For example:
pwsh -NoProfile -File scripts\run-adhoc-traffic-and-eval.ps1 -EnvName aiobs3-foundry
|
Parameter |
Default |
Description |
|
-EnvName |
currently-selected azd env |
azd env to refresh. Run azd env select <name> first or pass this explicitly. |
|
-MaxPrompts |
10 |
Number of seed prompts in the warmup+seed phase. Use 0 for the full ~48 corpus. |
|
-RunRedTeam |
(off) |
Include the red-team scan (~8 extra min). Off by default. |
|
-LogFile |
scripts/e2e-adhoc-run.log |
Output is streamed live to the console and written to this file. |
The wrapper calls run-e2e.ps1 with -SkipPhases 1,2,3,4,5,8,11 (plus 10 when red-team is not requested), so the phases that run are:
|
Phase |
What you get |
|
6 |
Warmup (3 pings) + seed N prompts |
|
7 |
Fan-out: 12 tool prompts across 3 working agents + 8 broken-model invokes |
|
9 |
Fresh batch eval (8 agent evaluators) over the new traces (2-hour lookback in Application Insights) |
|
10 |
Fresh red-team scan (only with -RunRedTeam) |
|
12 |
Refresh artifacts/telemetry.json |
|
13 |
Smoke invoke + verify batch eval artifact |
Total time end to end: ~15 min by default (~25 min with red-team).
Live progress the streams to both the console and the log file, so you can also tail it from another terminal:
Get-Content -Wait scripts\e2e-adhoc-run.logReference run transcript: A masked log from a successful ad-hoc run is captured in scripts/e2e-adhoc-run.log.
3. Evaluation: agent evaluators and custom checks
A 200 OK does not mean the agent answered correctly. Traditional software has predictable outputs; AI agents do not. The same prompt can produce different responses across runs, and quality can shift when models update, prompts evolve, or tools change. Without evaluation, you are relying on user complaints to discover quality problems, often days after the damage is done.
This section covers how the kit scores every response using Microsoft Foundry's built-in agent evaluators and a custom code-based evaluator, both run as batch jobs over traces stored in Application Insights.
3.1 Two evaluation paths
The starter kit includes two complementary approaches. Each serves a different need:
|
Path |
When it runs |
What it checks |
Best for |
|
Agent evaluators |
On demand (batch run over traces) |
8 built-in evaluators covering system outcomes and process quality |
Measuring end-to-end agent quality and tool usage |
|
Custom evaluators |
On demand (batch run over traces) |
Any domain-specific rule (compliance phrases, format checks, policy) |
Enterprise requirements beyond built-in evaluators |
3.2 Agent evaluators
Microsoft Foundry provides 9 built-in agent evaluators split into two categories: system evaluators that examine the end-to-end outcome (task adherence, task completion, intent resolution) and process evaluators that examine each step in the workflow (tool call accuracy, tool selection, tool input accuracy, tool output utilization, tool call success). The 9th evaluator, Task Navigation Efficiency, requires ground truth and is not included in the default batch run.
The kit runs all 8 evaluators in a single batch over the agent's traces stored in Application Insights via scripts/20-agent-batch-eval.py.
Results from a validated run (11 traces scored across 8 evaluators):
|
Evaluator |
Score |
Highlight |
|
task_adherence |
73% (8/11) |
Followed system instructions in 8 of 11 cases |
|
task_completion |
64% (7/11) |
4 failures include intentional error-trigger prompts |
|
intent_resolution |
73% (8/11) |
Correctly identified and addressed the user's intent |
|
tool_call_accuracy |
80% (8/10) |
Right tools with correct parameters |
|
tool_selection |
73% (8/11) |
No unnecessary tool calls |
|
tool_input_accuracy |
82% (9/11) |
Correctly formatted and grounded parameters |
|
tool_output_utilization |
55% (6/11) |
Strictest process evaluator: did the agent use tool results in its answer? |
|
tool_call_success |
82% (9/11) |
2 failures are the intentional error triggers |
Each evaluator requires a data_mapping that tells Foundry which trace fields to read. System evaluators need query + response; process evaluators add tool_definitions and tool_calls. All evaluators also require deployment_name as an initialization parameter. Missing any of these produces a MissingRequiredDataMapping error (Foundry's signal that the eval contract is incomplete). If you hit it, verify your data_mapping dictionary includes every required field for the evaluators you are running, and that those fields actually exist on the App Insights trace records the run is reading from.
3.3 Custom evaluator: compliance phrase check
Built-in evaluators cover agent quality and tool usage, but most teams also need domain-specific checks. Microsoft Foundry supports custom evaluators in two flavors: code-based (a Python grade() function returning a float 0.0 to 1.0, deterministic and ideal for pass/fail rules like compliance phrases, format checks, or regex matches) and prompt-based (a judge prompt evaluated by an LLM, useful for fuzzy criteria like tone or helpfulness). The kit demonstrates the code-based pattern with a compliance disclaimer checker.
The workflow has three steps: (1) write a grade(sample, item) function in evaluators/custom_compliance_phrase.py that checks whether the response contains a required disclaimer phrase and returns 1.0 or 0.0, (2) register it with Microsoft Foundry via scripts/11-custom-evaluator-register.py, which uploads the source, defines the metric, and sets the pass threshold, and (3) include it in any batch evaluation's testing_criteria alongside built-in evaluators.
Results from a validated run (10 traces scored):
The compliance_check evaluator scored 40% (4 of 10 traces passed). The 4 passing traces came from prompts that explicitly asked for the disclaimer; the 6 failures had normal responses without it. Swap in your own logic, re-register, and the same pattern works for any policy, format, or regulatory check.
Interactive alternative: For live demos or step-by-step exploration, the notebooks/ folder contains Jupyter notebook versions of the evaluation setup: 01-continuous-eval-setup.ipynb (eval group + rule + batch run) and 02-custom-evaluator-register.ipynb (custom evaluator registration). These run the same SDK calls as the scripts but let you execute cell by cell. To run all four notebooks in sequence without opening them, use notebooks/run_notebooks.ps1.
4. Red-team testing: automated safety scanning
Quality evaluators check whether the agent answered well. Red-teaming checks whether it can be tricked into answering badly: adversarial users who actively try to provoke harmful, off-topic, or policy-violating responses. Models that pass quality evaluations can still fail when the input is crafted to exploit edge cases. The kit automates this with a Foundry-managed scan that generates attack prompts, sends them over multi-turn conversations, and scores each response against safety evaluators. For the full SDK reference, see Run AI red teaming in the cloud.
4.1 How the scan works
scripts/12-red-team.py handles everything in a single script:
The script creates a temporary prompt agent (redteam-prompt-agent) mirroring the production agent's model, instructions, and tool definitions, then builds an eval group with three safety evaluators (prohibited actions, task adherence, sensitive data leakage) and a taxonomy mapping the PROHIBITED_ACTIONS risk category to the target. It launches an attack run that auto-generates adversarial prompts over 5-turn conversations, and cleans up the temporary agent in a finally block. Typical run time: 4 to 8 minutes.
4.2 Results and interpretation
The scan uses three safety evaluators (Prohibited Actions, Task Adherence, Sensitive Data Leakage) and two attack strategies (Flip and Base64).
Additional strategies like IndirectJailbreak, Tense, Morse, and Crescendo can be added to the attack_strategies list in the script.
Results from a validated run (total=204, passed=139, failed=65, errored=0):
The attack success rate (ASR) of 31.9% (65 failed prompts out of 204 total) means the attacker elicited undesirable responses in roughly one-third of attempts. Breaking down by evaluator: Prohibited Actions had the highest ASR at 38%, Sensitive Data Leakage at 29%, and Task Adherence the lowest at 21%. All three attack strategies (Base64, Baseline, Flip) performed similarly at 31-34%, suggesting the model's safety posture is consistent regardless of encoding technique and that custom safety system prompts would be needed to materially reduce the overall rate.
Per-prompt verdicts are saved to artifacts/redteam_eval_output_items_redteam-prompt-agent.json.
Interactive alternative: The notebooks/ folder splits the red-team workflow into two notebooks: 03-red-team-taxonomy.ipynb (pre-stage the taxonomy) and 04-red-team-run.ipynb (launch the attack run and collect results).
5. Observability
Once the agents are deployed and traffic is flowing, you need to see what is happening. This section covers the two ways the kit surfaces telemetry: raw KQL queries for ad-hoc investigation, and three dashboard surfaces for day-to-day monitoring.
5.1 Querying telemetry with KQL
The scripts/13-telemetry-kql.py script runs four queries against the Log Analytics workspace, each answering a different operational question. All queries filter on invoke_agent spans from the requests table.
|
KQL Query |
What it answers |
Key fields |
|
Volume + success rate |
How many invocations per agent, and how many failed? |
count(), countif(success), dcount(operation_Id) by name |
|
Latency percentiles |
What is the p50/p90/p95/p99 response time? |
percentile(duration, N), avg(duration), max(duration) |
|
Session activity |
How is traffic distributed over time and across sessions? |
session_id from customDimensions, bin(timestamp, 5m) |
|
Token usage |
How many input/output tokens are being consumed? |
gen_ai.usage.input_tokens, gen_ai.usage.output_tokens from customDimensions |
These are the same signals that power the Grafana dashboard panels. The full KQL for each query is in scripts/13-telemetry-kql.py.
5.2 Visualizing telemetry: three viewing surfaces
The KQL queries above are useful for ad-hoc investigation, but for day-to-day monitoring you want dashboards. The starter kit populates three complementary views, each serving a different audience.
5.3 App Insights Agents pane
The Agents (Preview) pane in Azure Application Insights is the fastest way to see agent health. It populates automatically from the OpenTelemetry spans this kit emits, with no dashboard import or configuration required.
After a successful run, the pane shows:
|
Panel |
What it surfaces |
Why it matters |
|
Agent Runs |
Invocations per agent over time |
basic-responses handled 26 runs vs 9 for the broken agent: spot traffic imbalances instantly |
|
Gen AI Errors |
Errors by operation type (invoke_agent, chat, execute_tool) |
11 invoke errors, 2 tool errors, 1 chat error: pinpoint which layer is failing |
|
Tool Calls |
Per-tool call count, error count, avg duration |
get_orders shows 4 errors at 18.06s avg: find broken or slow tools before users report them |
|
Models |
Per-model call count, error rate, avg duration |
nonexistent-model-deployment-xyz shows 775.33ms with 3 calls, all errors: catch misconfigured deployments |
|
Token Consumption |
Token usage stacked by model |
gpt-4o-mini at 69.9K, gpt-5-mini at 36.8K, gpt-4.1-mini at 34.1K: identify which model drives cost |
|
Evaluations |
Score tiles for each evaluator |
intent_resolution 3.96, tool_call_accuracy 4.13, coherence 3.95: confirm scores stay above thresholds |
Access it from Application Insights > left menu > Agents (Preview). Set the time range to "Last 48 hours" to clear past the 15–30-minute rollup lag.
5.4 Prebuilt Grafana dashboards
Three Azure-managed dashboards ship out of the box and populate from the same telemetry:
|
Panel |
What it surfaces |
Why it matters |
|
Agent Framework |
Per-agent KPIs: run count, latency, token spend, tool usage |
Single-pane overview of all agent operations |
|
Agent Framework workflow |
Multi-step workflows and orchestration patterns |
Trace multi-agent or multi-step pipelines |
|
Foundry |
Hosted-agent specifics: project, deployment, version, identity |
Verify which agent version is live and healthy |
The Agent Framework dashboard is the broadest of the three, covering operations, tokens, tools, and performance in a single view:
|
Panel |
What it surfaces |
Why it matters |
|
Summary Statistics |
68 total operations, 65K input tokens, 4.68K output tokens, 9.97s avg response |
At-a-glance health and cost snapshot |
|
Token Consumption Over Time |
Input/output token trends with per-agent breakdown |
gpt-4o-mini at 32.6K, gpt-4.1-mini at 17.5K, gpt-5-mini at 17.5K: spot cost shifts |
|
Daily Cost Estimation |
Estimated daily cost ($0.0256 in this run) |
Budget tracking without leaving the dashboard |
|
Tool Usage Leaderboard |
Per-tool call count, success rate, avg/p95 latency |
get_orders at 77.8% success, roll_dice at 100%: find unreliable tools |
|
Chat p95 Latency by Model |
p95 chat latency per model |
Compare model responsiveness side by side |
|
Agent Response Time Trends |
Latency over time with min/mean bands |
Detect latency regressions correlated with deployments |
|
Success Rate |
Overall success percentage (98.5% in this run) |
Single green/red signal for on-call triage |
|
Agent Performance Summary |
Per-agent operations, avg duration, success rate |
broken-model at 88.9% success: confirm intentional error agents |
|
Agent Utilization Heatmap |
Activity intensity by agent and time bucket |
Visualize traffic patterns and idle periods |
5.5 Custom dashboards
The kit ships two importable dashboard JSON files in artifacts/grafana/. The primary dashboard (agent-observability-dashboard.json) provides a full operational overview:
|
Panel |
What it surfaces |
Why it matters |
|
Agent Summary Statistics |
68 operations, 60.6K input tokens, 4.25K output tokens, 9.97s avg response |
Single row confirms overall health and cost |
|
Chat and Tool Summary |
115 LLM calls, 34 chat sessions, 63 tool calls, 5.13s avg chat latency |
Understand the composition of each request |
|
Operations Over Time |
Invocation counts (chat, execute_tool, invoke_agent) over time |
Spot traffic spikes or quiet periods |
|
Token Consumption by Model |
gpt-4o-mini dominates at ~35K, gpt-5-mini and gpt-4.1-mini follow |
Identify which model drives cost |
|
Model Usage Distribution |
gpt-4o-mini 50%, gpt-5-mini 25%, gpt-4.1-mini 24%, broken-model 1% |
Validate load distribution across deployments |
|
Response Duration by Model |
gpt-4o-mini ~6s avg/7s p90, gpt-5-mini ~6s, broken-model near 0 |
Catch latency regressions per model |
|
Chat Latency by Model |
p50 and p90 chat-level latency per model |
gpt-5-mini shows highest p90: drill into model-level performance |
A companion dashboard (agent-observability-custom-dashboard.json) adds five focused panels for deeper investigation (per-tool p95 latency, error rate, session counts).
To import: Application Insights > Dashboards with Grafana > New > Import > upload the JSON. Both use templated variables, so the same JSON works across environments. For the full walkthrough, see docs/GRAFANA_GUIDE.md.
6. Repository structure
At a glance:
|
Folder |
What's inside |
|
agent/ |
azd project root: 4 hosted agents, Bicep infra (Foundry account, ACR, Application Insights, Log Analytics) |
|
scripts/ |
run-e2e.ps1 orchestrator, validate-deployment.ps1, teardown.ps1, run-adhoc-traffic-and-eval.ps1, plus 13 numbered Python/PowerShell helpers |
|
evaluators/ |
Custom code-based evaluator (grade(sample, item) -> float) + YAML metadata |
|
prompts/ |
Three corpora: clean, ambiguous, safety-bait |
|
artifacts/ |
All run outputs (eval results, telemetry, dashboards). grafana/ holds importable dashboard JSON |
|
notebooks/ |
Jupyter versions of the eval and red-team flows for live demos |
|
docs/ |
QuickStart, manual deep-dive guide, Grafana guide |
/
  agent/                              # azd project root
    azure.yaml                        # service definitions for 4 hosted agents
    src/
      agent-framework-agent-basic-responses/
        agent.yaml                    # primary agent (gpt-4o-mini)
        main.py                       # @tool functions + Agent() constructor
        requirements.txt              # agent-framework + foundry-hosting deps
        Dockerfile                    # container build
      agent-framework-agent-gpt5-mini/
        agent.yaml                    # sister agent (gpt-5-mini)
        main.py                       # same code, different model
      agent-framework-agent-gpt41-mini/
        agent.yaml                    # sister agent (gpt-4.1-mini)
      agent-framework-agent-broken-model/
        agent.yaml                    # deliberately broken (populates error charts)
    infra/                            # Bicep (Foundry account, ACR, Application Insights, Log Analytics)
  scripts/
    run-e2e.ps1                       # single command: provision to smoke test (13 phases)
    validate-deployment.ps1           # post-deploy validation (8 categories)
    teardown.ps1                      # single command: destroy everything + purge
    run-adhoc-traffic-and-eval.ps1    # ad-hoc traffic + eval refresh (skips infra/deploys)
    03-grant-foundry-user.ps1         # grants Foundry User role to project MI
    04-warmup.ps1                     # 3 fast pings to defeat scale-to-zero
    05-seed-traffic.ps1               # 48 prompts from clean, ambiguous, safety-bait corpora
    06b-alerts-rest.py                # 2 scheduled-query alerts via ARM REST
    10-continuous-eval.py             # evaluation rule (3 agent evaluators)
    11-custom-evaluator-register.py   # code-based compliance evaluator (grade -> float)
    12-red-team.py                    # adversarial red-team scan (temporary prompt agent)
    13-telemetry-kql.py               # KQL export (volume, latency, tokens)
    14-verify-continuous-eval.py      # verify eval runs completed
    15-list-eval-rules.py             # debug: dump eval rule definitions + runs
    16-list-rules.py                  # debug: list all evaluation rules (GA API)
    17-list-connections.py            # debug: list project connections
    18-trigger-eval-runs.py           # debug: store-based eval trigger workaround
    20-agent-batch-eval.py            # batch eval: 8 agent evaluators over Application Insights traces
  evaluators/
    custom_compliance_phrase.py       # grade(sample, item) -> float (0.0 or 1.0)
    custom_compliance_phrase.yaml     # evaluator metadata for Foundry catalog registration
  prompts/
    clean.txt                         # normal traffic prompts
    ambiguous.txt                     # edge-case prompts
    safety-bait.txt                   # 5 adversarial prompts for safety testing
  artifacts/                          # all run outputs (eval results, telemetry, dashboards)
    sample-app-request.json           # reference: OTel GenAI span shape
    sample-chat-dependency.json       # reference: LLM chat dependency span shape
    grafana/
      agent-observability-dashboard.json          # full operational dashboard (7 panels)
      agent-observability-custom-dashboard.json   # companion dashboard (5 panels)
      DASHBOARD_IMPORT_GUIDE.md                   # import walkthrough
      DASHBOARD_SUMMARY.md                        # panel descriptions
  notebooks/                          # interactive Jupyter versions for live demos
    run_notebooks.ps1                 # runs all 4 notebooks in sequence via nbconvert
    01-continuous-eval-setup.ipynb    # eval group + rule + batch run over traces
    02-custom-evaluator-register.ipynb # custom evaluator registration
    03-red-team-taxonomy.ipynb        # taxonomy creation (pre-stage)
    04-red-team-run.ipynb             # red team attack run
  docs/
    QUICKSTART.md                     # 6-command walkthrough
    MANUAL_GUIDE.md                   # step-by-step deep dive
    GRAFANA_GUIDE.md                  # Grafana dashboard setup + custom KQL panels
7. Conclusion and next steps
AI observability is not an add-on. It is a prerequisite for operating agentic systems with confidence. This starter kit makes that concrete: a working Foundry-hosted agent, instrumented telemetry, dashboards, batch evaluation, adversarial red-team testing, compliance checks, and alerting, all provisionable in a single command and tearable in another.
Try it now
Fork the repo and run end to end on your subscription:
git clone https://github.com/jvargh/ai-observability-starter-kit
cd ai-observability-starter-kit
pwsh -NoProfile -File scripts\run-e2e.ps1 -Region eastus2 -EnvName aiobs-foundry -SubscriptionId <your-subscription-id>
Connect and contribute
Open an issue or discussion on GitHub if you find a bug, want a feature, or have ideas to share back. Pull requests are welcome.

 Microsoft